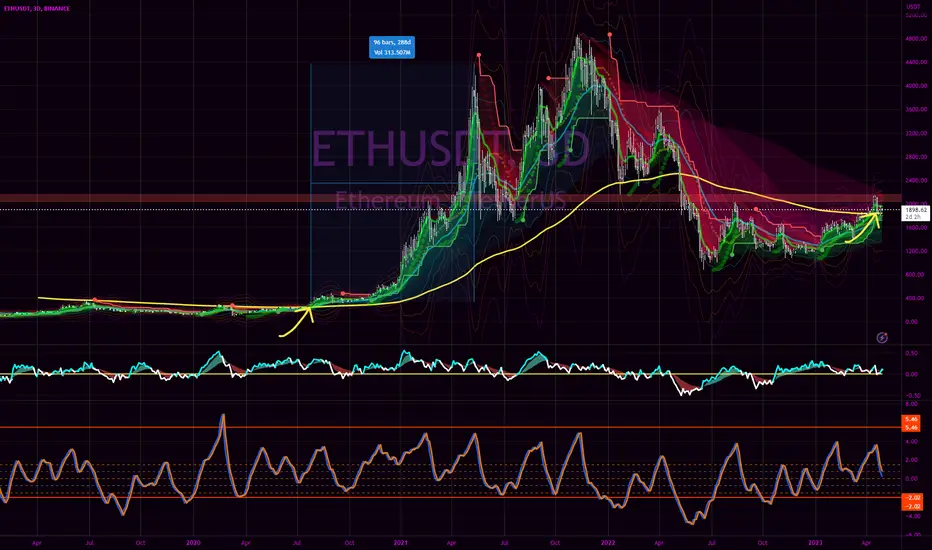
Observe prior fractals of PA breaking 200 EMA (YELLOW LINE) on 3 Day chart. High likelihood of bull run. One may place extra confidence in LONG entries while we are this close and above 200 EMA on 3D.
As always, not financial advice.
As always, not financial advice.
The degen in me sees the degen in you.
Disclaimer
The information and publications are not meant to be, and do not constitute, financial, investment, trading, or other types of advice or recommendations supplied or endorsed by TradingView. Read more in the Terms of Use.
The degen in me sees the degen in you.
Disclaimer
The information and publications are not meant to be, and do not constitute, financial, investment, trading, or other types of advice or recommendations supplied or endorsed by TradingView. Read more in the Terms of Use.