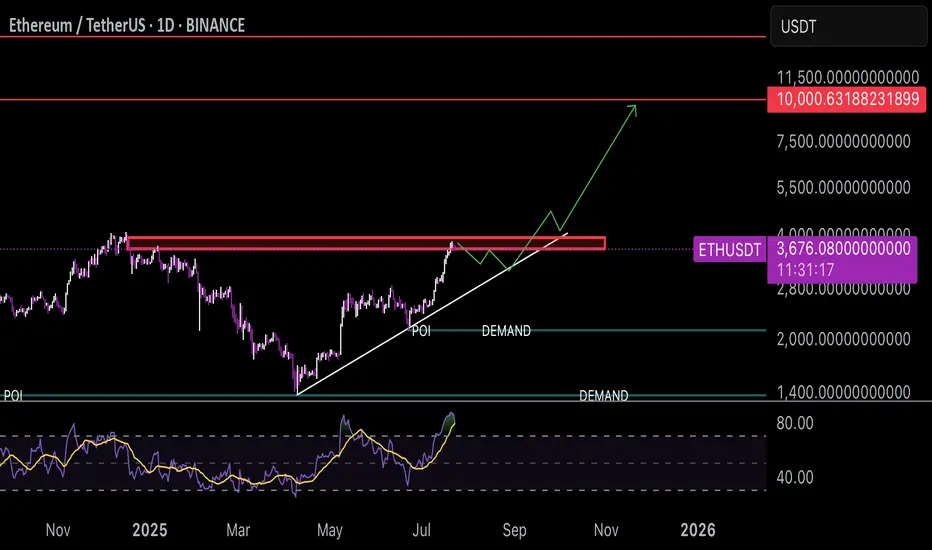
For a technical analysis of the provided ETH/USDT 1D chart, here are the key points:
1. **Current Price and Changes**: The current price is around 3,672.23 USD, down 1.99% (74.54 USD) from the previous day.
2. **Support and Resistance Levels**:
- **Resistance**: Near 3,672.24 USD (current SELL level), marked by the red line.
- **Supports**: Demand levels around 1,800 and 40 USD indicate potential support zones if the price drops significantly.
3. **Trend and Direction**: An upward trend line from the chart's bottom to the current point suggests an overall bullish trend, though the recent break below the resistance line may indicate weakness.
4. **Indicators**:
- The POI (Point of Interest) line near 3,672 USD highlights a key level where price is fluctuating.
- The lower indicator (likely RSI or similar) shows price oscillations, currently in a neutral zone with no clear buy or sell signal.
5. **Short-Term Outlook**: If the price fails to stabilize above 3,672 USD, it may move toward lower demand levels (e.g., 1,800 USD). A breakout and stabilization above resistance could target 10,000 USD (based on the upward trend line).
For a more detailed analysis, consider adding indicators like MACD or Bollinger Bands. Would you like me to create a visual chart in a separate panel?
Disclaimer
The information and publications are not meant to be, and do not constitute, financial, investment, trading, or other types of advice or recommendations supplied or endorsed by TradingView. Read more in the Terms of Use.
Disclaimer
The information and publications are not meant to be, and do not constitute, financial, investment, trading, or other types of advice or recommendations supplied or endorsed by TradingView. Read more in the Terms of Use.