Chart Insights:
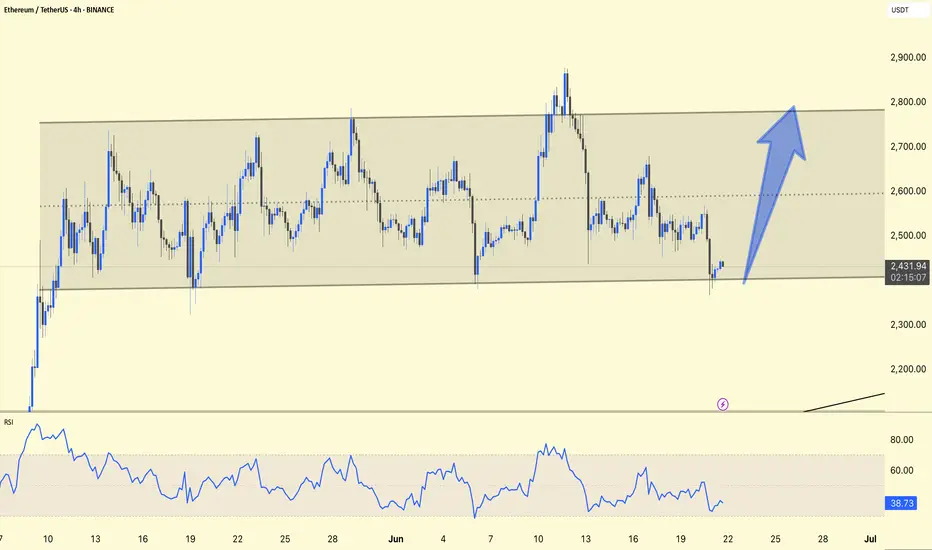
ETH is holding the lower trendline support (~$2,430), which indicates a potential reversal zone.
The RSI is hovering around 39, which indicates oversold territory, suggesting that buyers may step in soon.
Expected Move:
The chart predicts a strong move upwards towards the $2,800–2,900 zone (blue arrow), which aligns with the top range boundary.
Trade Plan:
Buy Zone: Near the lower trendline ($2,430–2,450)
Stop Loss: Just below the trendline ($2,400)
Target: Near the upper range boundary (~$2,800–2,900)
Stay alert!
Related publications
Disclaimer
The information and publications are not meant to be, and do not constitute, financial, investment, trading, or other types of advice or recommendations supplied or endorsed by TradingView. Read more in the Terms of Use.
Related publications
Disclaimer
The information and publications are not meant to be, and do not constitute, financial, investment, trading, or other types of advice or recommendations supplied or endorsed by TradingView. Read more in the Terms of Use.