Hello everyone, let's take a look at the ETH to USDT 1 day chart.
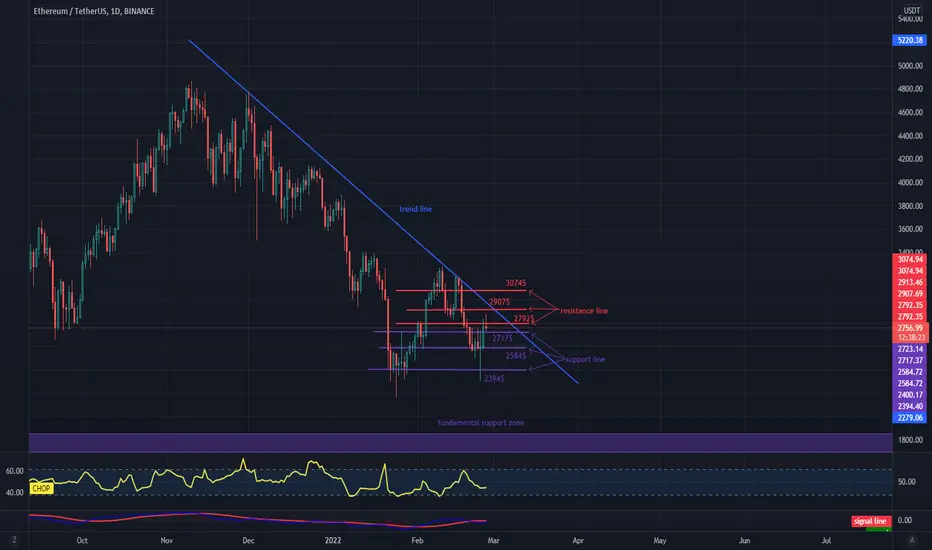
Let's start by marking the downtrend line, because you can see that the price is moving below it and getting closer to it.
Now let's move on to the support line, as you can see, the first support is around $ 2,717, above which the price is currently hitting, the next support is $ 2,584 and $ 2,394.
We are between the support and the first resistance at $ 2,792, another resistance at $ 0.618Fib at $ 2907, and another resistance at $ 3,074.
It is worth paying attention to the CHOP indicator, which shows that the energy in the 1-day interval has not touched the bottom and is slowly starting to turn back.
Disclaimer
The information and publications are not meant to be, and do not constitute, financial, investment, trading, or other types of advice or recommendations supplied or endorsed by TradingView. Read more in the Terms of Use.
Disclaimer
The information and publications are not meant to be, and do not constitute, financial, investment, trading, or other types of advice or recommendations supplied or endorsed by TradingView. Read more in the Terms of Use.