A more comprehensive analysis for Ethereum is as follows:
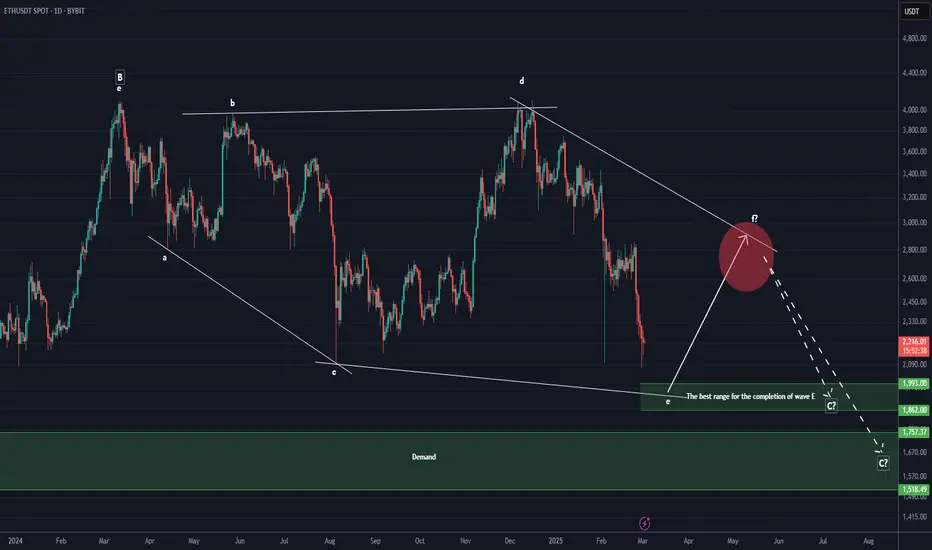
It seems that wave E of our Diametric is nearing completion. For wave F, Ethereum should experience upward retracements and spend some time consolidating.
The best zone for the completion of wave E is marked on the chart as the upper green box.
The optimal rejection area for price to move downward and complete wave F is marked by the red circle. Now, we wait to see whether the price reaches this zone for wave F or not.
Wave G may have two potential targets: either the upper or lower green box at the bottom of the chart.
For risk management, please don't forget stop loss and capital management
Comment if you have any questions
Thank You
Trade active
Since wave E is nearing completion, the green zone will not be easily lost, and we will see upward bounces.We are witnessing the first reaction to the green box.
This month could be a recovery month for altcoins, but it’s important not to take too much risk, as this is a corrective wave F.
Let’s see what happens
🔆To succeed in trading, just enter our Telegram channel:
Free membership: t.me/Behdark_EN
🔷Our Telegram channel has daily spot and futures signals 👉 t.me/Behdark_EN
💎 Exclusive signals are only shared on our Telegram channel
Free membership: t.me/Behdark_EN
🔷Our Telegram channel has daily spot and futures signals 👉 t.me/Behdark_EN
💎 Exclusive signals are only shared on our Telegram channel
Disclaimer
The information and publications are not meant to be, and do not constitute, financial, investment, trading, or other types of advice or recommendations supplied or endorsed by TradingView. Read more in the Terms of Use.