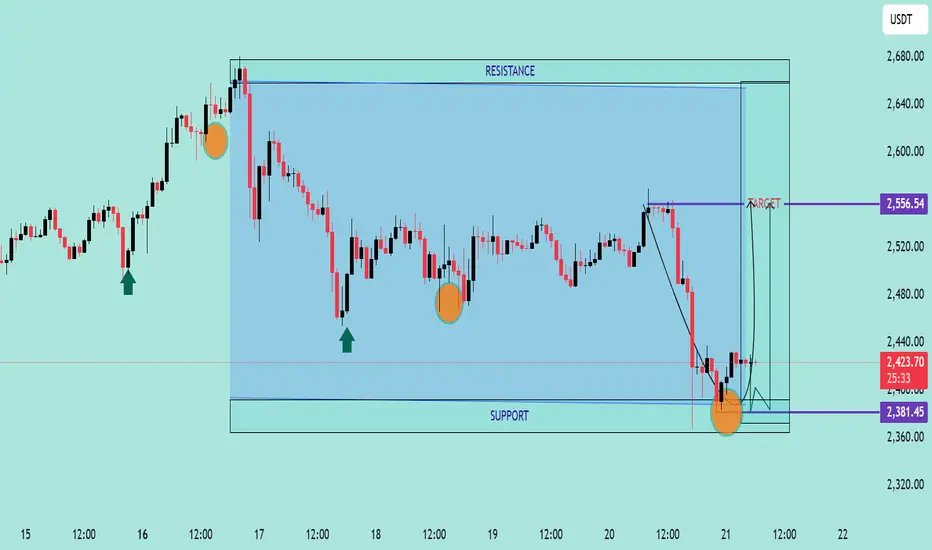
Chart Analysis:
The chart illustrates a range-bound consolidation with clear support around $2,381.45 and resistance near $2,556.54.
🔍 Key Observations:
✅ Multiple Support Tests: Price has tested the support zone several times (highlighted by orange circles) and respected it, indicating strong buying interest at the lower boundary.
📉 Fakeout and Recovery: A false breakout below support occurred, but the candle quickly reversed, signaling a bear trap and potential for bullish momentum.
🔼 Rejection Wick & Consolidation: A strong rejection wick on the most recent candlestick shows buyers defending the zone aggressively. The current price action shows consolidation — a bullish accumulation pattern.
🎯 Upside Target: Based on the range breakout projection, the price could potentially revisit the resistance zone at $2,556.54, marked as the TARGET on the chart.
📌 Technical Outlook:
🟢 Bias: Bullish as long as the price holds above $2,381.45.
💹 Entry Idea: Aggressive buyers may enter near current levels with a stop below the wick low.
🛑 Risk Level: Tight stop-loss needed as the structure relies heavily on support holding.
📈 Conclusion:
A classic range rebound setup is forming with potential for upside movement back toward resistance. A breakout above $2,556.54 could initiate a trend continuation rally
JOIN MY TELEGRAM CHANNEL
t.me/StellarMarketAnalysis
JOIN MY RECOMMENTED BROKER REFFREL LINK
⤵️one.exnesstrack.net/a/uvd1etcgg1
PARTNER CODE⤵️
uvd1etcgg1
t.me/StellarMarketAnalysis
JOIN MY RECOMMENTED BROKER REFFREL LINK
⤵️one.exnesstrack.net/a/uvd1etcgg1
PARTNER CODE⤵️
uvd1etcgg1
Disclaimer
The information and publications are not meant to be, and do not constitute, financial, investment, trading, or other types of advice or recommendations supplied or endorsed by TradingView. Read more in the Terms of Use.