Hi All,
(ref. B.charts)
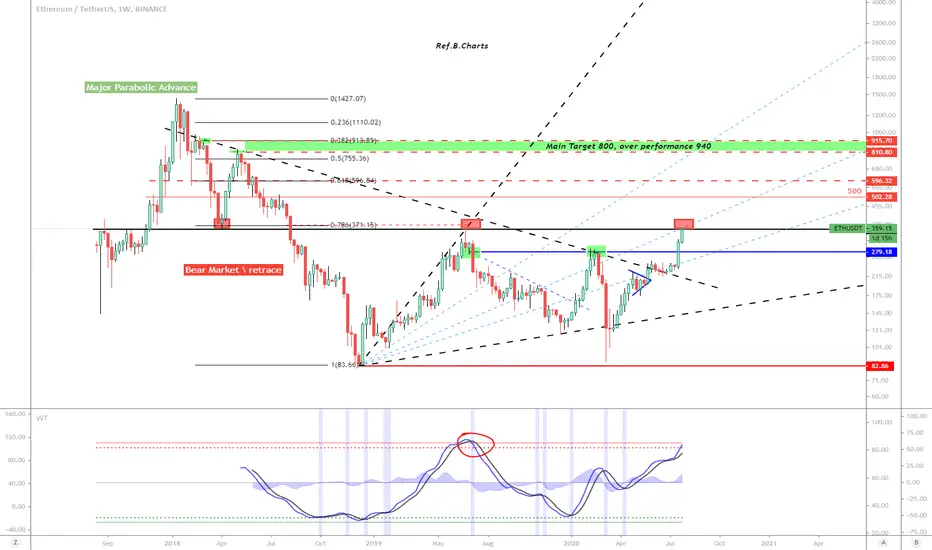
Looking at the weekly chart, we can observe the following:
a) Strong resistance level (refer to red markings) = $360
b) If it we breaks this, more so when we break it, then based on the inverted BARR strategy, we have $800 to $940 (over performance) range as the macro target.
$500 will be another interim resistance.
We need to see this break above $360 with at least a daily open and close candle before we can look at validating it.
c) Target levels have Fib. retracement levels in confluence with Inverted Barr targets.
My thoughts, we are likely to break it soon if not today and then get the retest on this level, definitely.
Why, because the WT indicator shows room to the upside before it crosses over.
FYI, I'm still holding to go long just like with BTC (13500 to 13800).
Please give me a like or tick for this post.
Regards,
S.Sari
12 HRLY chart, RSI looks extended

2D chart shows strong upward pressure

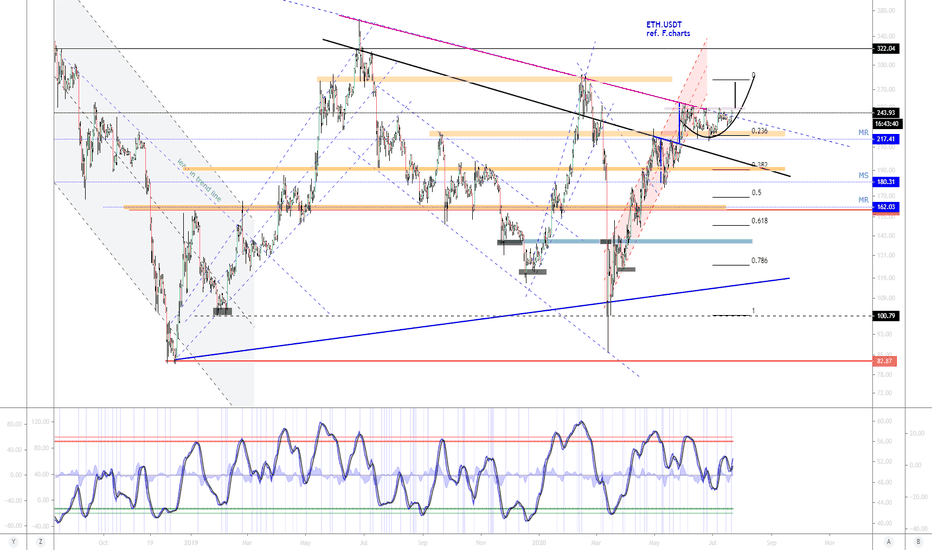
Weekly chart, note RSI trend line equates to resistance as well at this level.

Monthly chart with MR and MS, resistance and support
PREVIOUS POST with detailed TA information
(ref. B.charts)
Looking at the weekly chart, we can observe the following:
a) Strong resistance level (refer to red markings) = $360
b) If it we breaks this, more so when we break it, then based on the inverted BARR strategy, we have $800 to $940 (over performance) range as the macro target.
$500 will be another interim resistance.
We need to see this break above $360 with at least a daily open and close candle before we can look at validating it.
c) Target levels have Fib. retracement levels in confluence with Inverted Barr targets.
My thoughts, we are likely to break it soon if not today and then get the retest on this level, definitely.
Why, because the WT indicator shows room to the upside before it crosses over.
FYI, I'm still holding to go long just like with BTC (13500 to 13800).
Please give me a like or tick for this post.
Regards,
S.Sari
12 HRLY chart, RSI looks extended
2D chart shows strong upward pressure
Weekly chart, note RSI trend line equates to resistance as well at this level.
Monthly chart with MR and MS, resistance and support
PREVIOUS POST with detailed TA information
Note
ETH did a nice run but the dump has caused uncertainty and its struggling to stay above 360 on the daily.If it holds for another 2 days, then we have potentially re-accumulation area otherwise.. as per this chart.
Note
Price is holding above 360 even though I see downward pressure. I'm still hodling for the upper targets.Note
looking from the smaller time frames, key level broken, needs to hold longer now.Note
For now, 15 min chart and my levels show the squeeze and using CRD, the support zone Discord: discord.com/invite/vb4hbP88vb (TradeToProspa)
Telegram: t.me/TprospaTradersbot
This community has signals now but with no risk management comms.
Telegram: t.me/TprospaTradersbot
This community has signals now but with no risk management comms.
Related publications
Disclaimer
The information and publications are not meant to be, and do not constitute, financial, investment, trading, or other types of advice or recommendations supplied or endorsed by TradingView. Read more in the Terms of Use.
Discord: discord.com/invite/vb4hbP88vb (TradeToProspa)
Telegram: t.me/TprospaTradersbot
This community has signals now but with no risk management comms.
Telegram: t.me/TprospaTradersbot
This community has signals now but with no risk management comms.
Related publications
Disclaimer
The information and publications are not meant to be, and do not constitute, financial, investment, trading, or other types of advice or recommendations supplied or endorsed by TradingView. Read more in the Terms of Use.