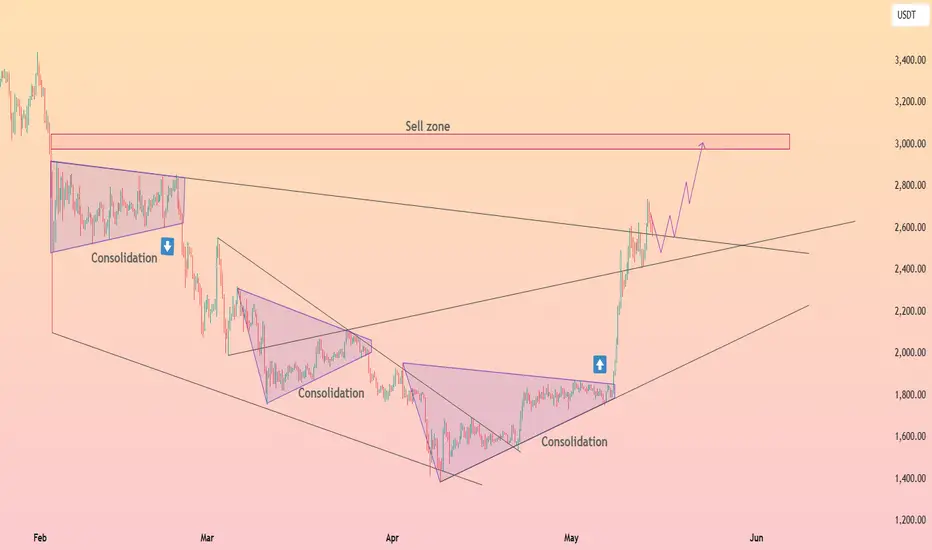
Ethereum price tore out of its multi‑month falling wedge and smaller consolidation triangle, blasting through the mid‑2 k range before pausing around 2.7 k. As long as price respects the former wedge roof as trendline support, bulls retain scope to probe the highlighted 2.8‑3.1 k sell zone. A soft pullback into 2.4‑2.5 k would be viewed as a constructive retest rather than trend failure.
Trade active
Ethereum snapped a six-month falling wedge, rocketing from the May triangle apex at 1.8 k to the current 2.3 k perch. The first pullback already kissed the broken wedge roof, turning it into support around 2.2 k. As long as that retest holds, the pattern’s measured move steers price toward the 2.8-3.0 k overhead sell zone highlighted in red. A dip under the new trendline would postpone, not cancel, the bullish script.
Related publications
Disclaimer
The information and publications are not meant to be, and do not constitute, financial, investment, trading, or other types of advice or recommendations supplied or endorsed by TradingView. Read more in the Terms of Use.
Related publications
Disclaimer
The information and publications are not meant to be, and do not constitute, financial, investment, trading, or other types of advice or recommendations supplied or endorsed by TradingView. Read more in the Terms of Use.