Ethereum (ETHUSD) Technical Outlook – Short-Term Levels and Potential Targets
📊 Key Insights:
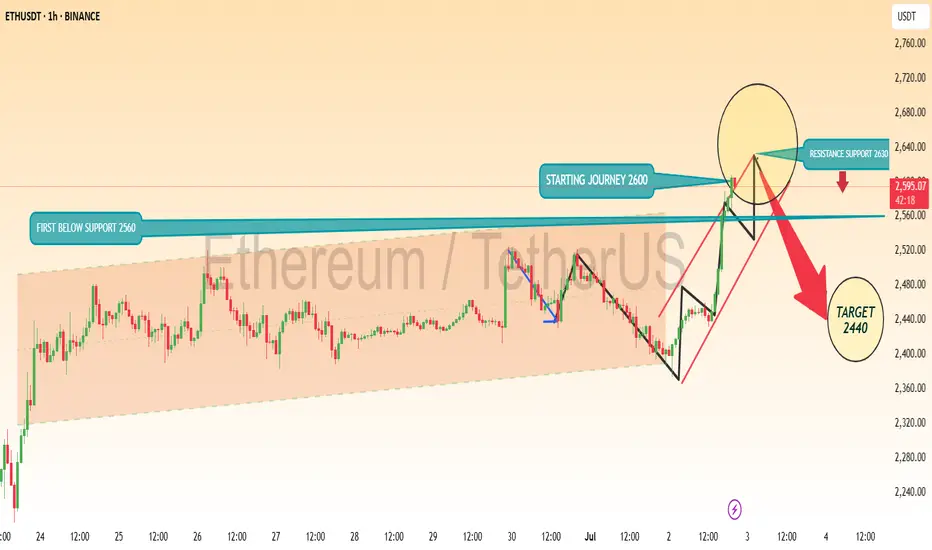
First Below Support: 2560 USDT
Starting Journey: 2600 USDT
Resistance Zone: 2630–2650 USDT
Target on Breakdown: 2440 USDT
Market Structure:
After a period of consolidation between 2560 and 2600, ETHUSD has initiated a sharp upward move towards the resistance zone near 2630–2650. The chart projects a possible rejection from this resistance area, suggesting a potential pullback targeting 2440 if support fails to hold.
✅ Key Considerations:
Watch for price action confirmation around 2630–2650.
A sustained break above resistance could invalidate the short-term bearish scenario.
The target zone of 2440 aligns with prior support and could offer buying interest
📊 Key Insights:
First Below Support: 2560 USDT
Starting Journey: 2600 USDT
Resistance Zone: 2630–2650 USDT
Target on Breakdown: 2440 USDT
Market Structure:
After a period of consolidation between 2560 and 2600, ETHUSD has initiated a sharp upward move towards the resistance zone near 2630–2650. The chart projects a possible rejection from this resistance area, suggesting a potential pullback targeting 2440 if support fails to hold.
✅ Key Considerations:
Watch for price action confirmation around 2630–2650.
A sustained break above resistance could invalidate the short-term bearish scenario.
The target zone of 2440 aligns with prior support and could offer buying interest
Trade active
active tradesWe share market insights, economic updates, and gold trend analysis. No financial advice. Join for educational content and healthy discussions
t.me/+IQGLYuRS6m80YTk0
EXNESS BROKER
one.exnesstrack.net/a/bzg6uf8tij
t.me/+IQGLYuRS6m80YTk0
EXNESS BROKER
one.exnesstrack.net/a/bzg6uf8tij
Disclaimer
The information and publications are not meant to be, and do not constitute, financial, investment, trading, or other types of advice or recommendations supplied or endorsed by TradingView. Read more in the Terms of Use.
We share market insights, economic updates, and gold trend analysis. No financial advice. Join for educational content and healthy discussions
t.me/+IQGLYuRS6m80YTk0
EXNESS BROKER
one.exnesstrack.net/a/bzg6uf8tij
t.me/+IQGLYuRS6m80YTk0
EXNESS BROKER
one.exnesstrack.net/a/bzg6uf8tij
Disclaimer
The information and publications are not meant to be, and do not constitute, financial, investment, trading, or other types of advice or recommendations supplied or endorsed by TradingView. Read more in the Terms of Use.