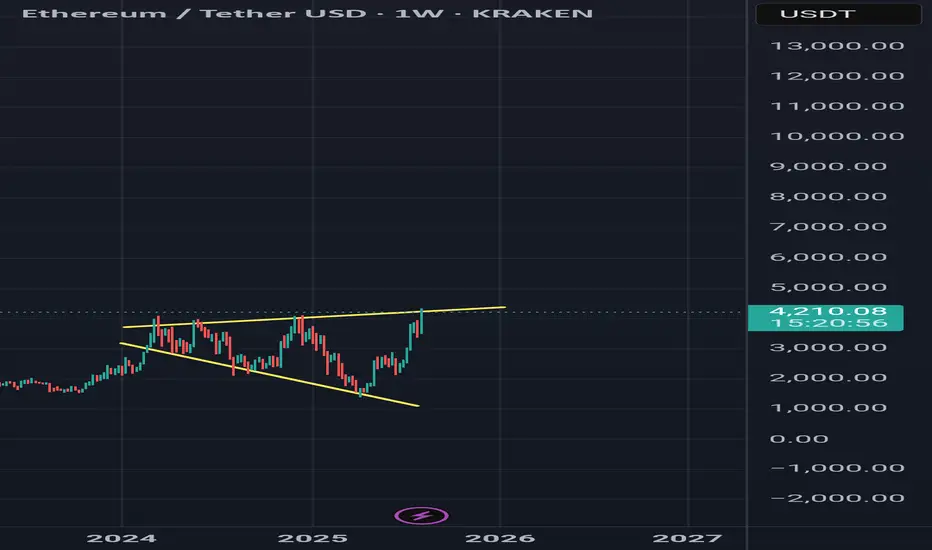
ETH/USDT weekly chart with those yellow trend lines forming what looks like a long-term ascending triangle / resistance ceiling just under the $4,300–$4,400.
---
1. Big Picture
The top yellow line is a multi-year resistance connecting the Nov 2021 and Mar 2022 highs.
ETH is right at that line now — this is where historically heavy selling pressure has appeared.
If ETH closes a weekly candle above $4,400 with strong volume, that’s a confirmed breakout of a 3-year structure.
---
2. Breakout Scenario
If we get a breakout:
Measured move from the base of the triangle (~$880 low to $4,400 resistance) = ~$3,520 height.
Add that to the breakout zone (~$4,400) → Target $7,900–$8,000 over months (not days).
First resistance after breakout: $4,870 (Fibonacci 2.0 extension & historical supply).
---
3. Rejection Scenario
If rejection happens here:
Possible pullback to $3,760–$3,820 (weekly demand / order block).
Deeper correction could target $3,130 if BTC also cools off.
---
4. Smart Money View
This is a high-liquidity zone — institutions & whales often engineer fake breakouts here to trap longs.
A weekly candle wick above $4,400 but close below could be a bull trap.
---
⚠️ Key takeaway:
Above $4,400 weekly close = bullish continuation → long-term $6.5k–$8k targets.
Fail to break $4,400 = short-term correction back toward $3.8k or lower.
Watch BTC at the same time — ETH almost never breaks multi-year highs alone.
---
1. Big Picture
The top yellow line is a multi-year resistance connecting the Nov 2021 and Mar 2022 highs.
ETH is right at that line now — this is where historically heavy selling pressure has appeared.
If ETH closes a weekly candle above $4,400 with strong volume, that’s a confirmed breakout of a 3-year structure.
---
2. Breakout Scenario
If we get a breakout:
Measured move from the base of the triangle (~$880 low to $4,400 resistance) = ~$3,520 height.
Add that to the breakout zone (~$4,400) → Target $7,900–$8,000 over months (not days).
First resistance after breakout: $4,870 (Fibonacci 2.0 extension & historical supply).
---
3. Rejection Scenario
If rejection happens here:
Possible pullback to $3,760–$3,820 (weekly demand / order block).
Deeper correction could target $3,130 if BTC also cools off.
---
4. Smart Money View
This is a high-liquidity zone — institutions & whales often engineer fake breakouts here to trap longs.
A weekly candle wick above $4,400 but close below could be a bull trap.
---
⚠️ Key takeaway:
Above $4,400 weekly close = bullish continuation → long-term $6.5k–$8k targets.
Fail to break $4,400 = short-term correction back toward $3.8k or lower.
Watch BTC at the same time — ETH almost never breaks multi-year highs alone.
Disclaimer
The information and publications are not meant to be, and do not constitute, financial, investment, trading, or other types of advice or recommendations supplied or endorsed by TradingView. Read more in the Terms of Use.
Disclaimer
The information and publications are not meant to be, and do not constitute, financial, investment, trading, or other types of advice or recommendations supplied or endorsed by TradingView. Read more in the Terms of Use.