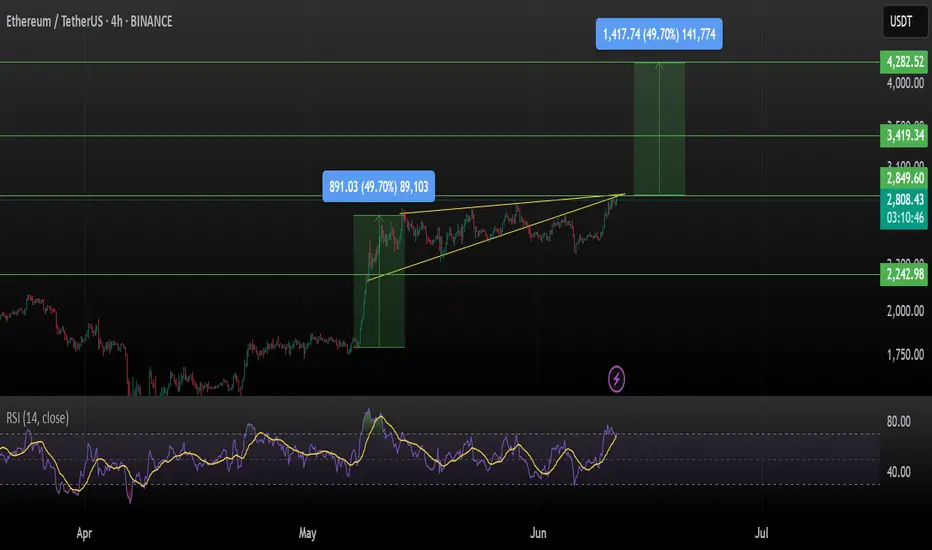
ETH is pressing against the upper resistance of a long-forming ascending triangle on the 4H chart — historically a bullish continuation pattern.
Previous Move:
Last breakout saw a +49.7% move, and the structure suggests we could see a similar surge again!
Key Levels:
Support: $2,242.98
Breakout Zone: $2,850
Resistance/Target 1: $3,419
Major Target 2: $4,282 (+49.7%)
RSI: 70.5 — strong momentum, near overbought but in breakout territory.
Volume seems to be increasing near resistance, a breakout could be imminent.
Potential Upside: +49.7% if triangle breaks cleanly.
Bias: Bullish
Timeframe: 4H
Watch for: Rejection at $2,850 or breakout retest for entry confirmation.
This is not financial advice, please do your research before investing, as we are not responsible for any of your losses or profits.
Please like, share, and comment on this idea if you liked it.
#ETH #Ethereum #ETHUSDT
Related publications
Disclaimer
The information and publications are not meant to be, and do not constitute, financial, investment, trading, or other types of advice or recommendations supplied or endorsed by TradingView. Read more in the Terms of Use.
Related publications
Disclaimer
The information and publications are not meant to be, and do not constitute, financial, investment, trading, or other types of advice or recommendations supplied or endorsed by TradingView. Read more in the Terms of Use.