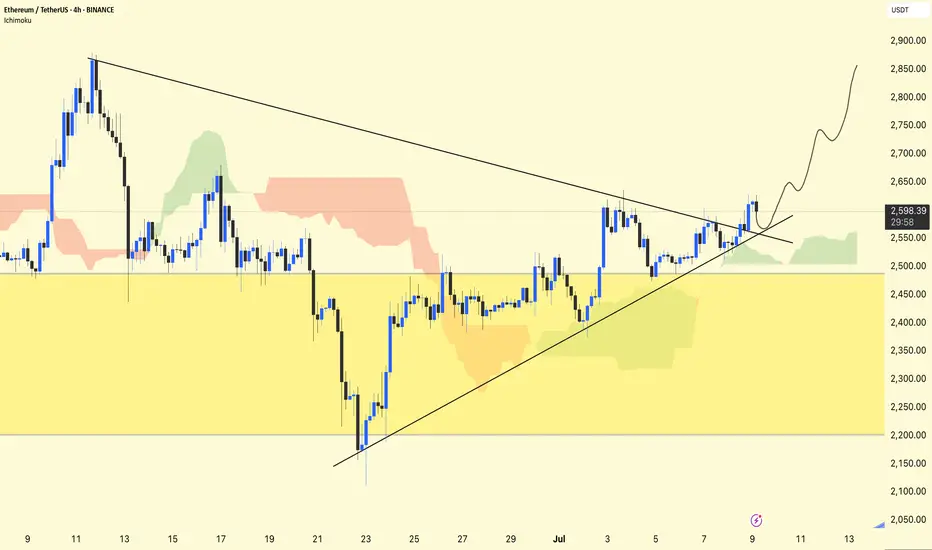
ETH has been trading inside a symmetrical triangle (shown by converging black trendlines).
A breakout has occurred above the descending trendline, signaling bullish momentum.
The rising diagonal trendline from late June is acting as strong support.
Ichimoku Cloud:
ETH is above the cloud, indicating a bullish bias.
The cloud below the price is green and fairly thin, suggesting modest support if the price dips back.
Key Levels:
Resistance Zone: $2,650–$2,700 (upper breakout zone).
Immediate Support: $2,550 trendline area.
Major Support Zone: $2,250–$2,450 (large yellow box). This has previously served as a significant accumulation zone.
Potential Scenario:
The price may retest the broken triangle trendline around $2,550–$2,570 (as indicated by the wavy projection on your chart).
Holding above this level could fuel a rally toward $2,750–$2,850 next.
Losing $2,550 would expose ETH back toward the bigger yellow support zone.
Short-Term Outlook:
Momentum favors bulls as long as ETH stays above ~$2,550.
Watch for volume on any move above $2,650 to confirm continuation toward higher targets.
Conclusion:
ETH has broken its triangle resistance and looks poised for further upside. A successful retest near $2,550–$2,570 could launch the next leg higher toward $2,750–$2,850.
Stay tuned for updates and key levels to watch!
Thanks for your support!
DYOR. NFA
Related publications
Disclaimer
The information and publications are not meant to be, and do not constitute, financial, investment, trading, or other types of advice or recommendations supplied or endorsed by TradingView. Read more in the Terms of Use.
Related publications
Disclaimer
The information and publications are not meant to be, and do not constitute, financial, investment, trading, or other types of advice or recommendations supplied or endorsed by TradingView. Read more in the Terms of Use.