💀 Hey , how's it going ? Come over here — Satoshi got something for you !
⏰ We’re analyzing ETH on the 1-hour timeframe timeframe .
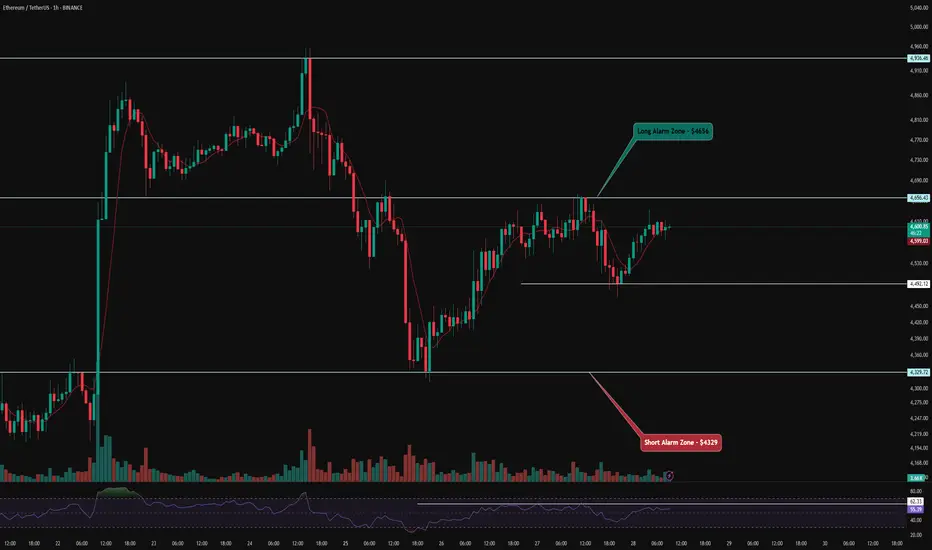
🔭 On the 1H timeframe for Ethereum, we can observe that ETH is moving inside a 1-hour range box, which has also formed with a V-pattern structure. A breakout and consolidation above or below this box can provide us with either a long or short trade setup.
⛏ The key RSI level is around 62, where Ethereum has been ranging for almost 2 days below this level with support around the 50 zone. Once the oscillation surpasses these levels, Ethereum can start its next move.
💰 The volume and number of green and red candles are almost equal. However, with larger green candles and rising volume, we can say that Ethereum is holding a good amount of accumulation volume.
📊 On the 1H timeframe of ETHBTC , we can observe that the alert zone for confirming a long position in Ethereum has slightly shifted lower, now sitting around 0.0415. Breaking this zone could allow Ethereum to move toward higher resistance levels and potentially even register a new all-time high.

💡 Looking at Ethereum’s alert zones, the level for a long position is around $4556, while the level for a short position is around $4329. With a breakout and consolidation above or below these areas, Ethereum gives us trade opportunities. Monitoring price behavior in these zones can be of great help in decision-making.
❤️ Disclaimer : This analysis is purely based on my personal opinion and I only trade if the stated triggers are activated .
⏰ We’re analyzing ETH on the 1-hour timeframe timeframe .
🔭 On the 1H timeframe for Ethereum, we can observe that ETH is moving inside a 1-hour range box, which has also formed with a V-pattern structure. A breakout and consolidation above or below this box can provide us with either a long or short trade setup.
⛏ The key RSI level is around 62, where Ethereum has been ranging for almost 2 days below this level with support around the 50 zone. Once the oscillation surpasses these levels, Ethereum can start its next move.
💰 The volume and number of green and red candles are almost equal. However, with larger green candles and rising volume, we can say that Ethereum is holding a good amount of accumulation volume.
📊 On the 1H timeframe of ETHBTC , we can observe that the alert zone for confirming a long position in Ethereum has slightly shifted lower, now sitting around 0.0415. Breaking this zone could allow Ethereum to move toward higher resistance levels and potentially even register a new all-time high.
💡 Looking at Ethereum’s alert zones, the level for a long position is around $4556, while the level for a short position is around $4329. With a breakout and consolidation above or below these areas, Ethereum gives us trade opportunities. Monitoring price behavior in these zones can be of great help in decision-making.
❤️ Disclaimer : This analysis is purely based on my personal opinion and I only trade if the stated triggers are activated .
join our Telegram channel for more insightful and educational content .
t.me/satoshiframe
t.me/satoshiframe
Related publications
Disclaimer
The information and publications are not meant to be, and do not constitute, financial, investment, trading, or other types of advice or recommendations supplied or endorsed by TradingView. Read more in the Terms of Use.