💀 Hey, how's it going ? Come over here — Satoshi got something for you!
⏰ We’re analyzing ETH on the 1-hour timeframe timeframe.
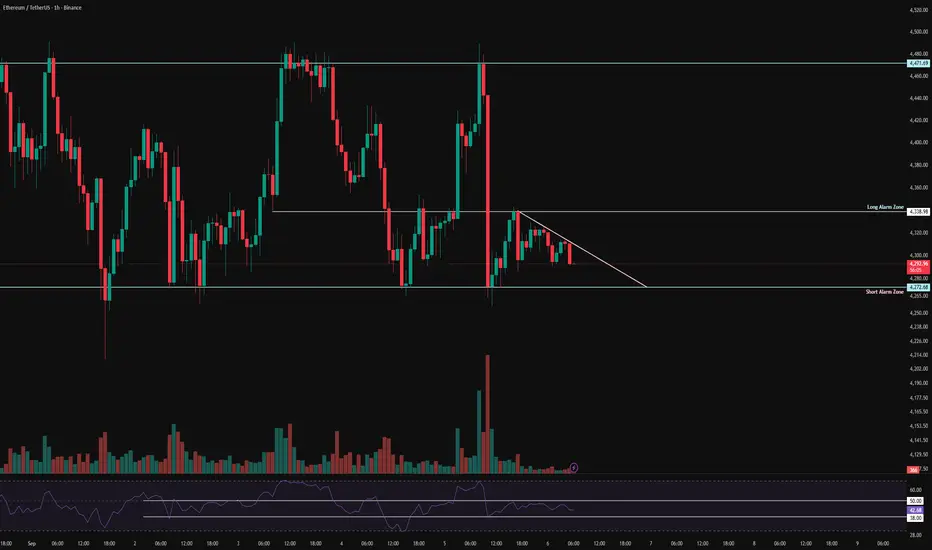
🔭 On the 1H timeframe for Ethereum, we can see that after yesterday’s news, ETH pushed upward toward the top of its range but failed to break out. From that resistance, it faced a heavy rejection, and this drop happened within just two 1H candles! At the moment, ETH is in a consolidation zone, and breaking out of this compression could provide us with an entry.
⛏ The key RSI oscillator levels are at 38 and 50. Once RSI breaks above or below these zones, Ethereum could start its next move following the effects of yesterday’s NFP news.
💰 The size and volume of red candles have increased sharply, showing strong selling pressure. The corrective bounce happened step by step, but then another fairly large red 1H candle was printed. With continued selling pressure, Ethereum may test lower price levels.
 🪙 On the 1H timeframe for the ETHBTC pair, we can see it is moving inside a multi-timeframe range. Each time it reaches the bottom of the box, volume increases and the price reacts with zig-zag moves. Note that the bottom of this box is at 0.03864, which has already been tested twice. This area should be considered as a short alert zone for ETHBTC.
💡 The alert zones for Ethereum itself are at 4,272$ and 4,338$. If either of these levels is broken, ETH could start a strong move, especially considering the momentum after yesterday’s NFP News.
❤️ Disclaimer : This analysis is purely based on my personal opinion and I only trade if the stated triggers are activated .
⏰ We’re analyzing ETH on the 1-hour timeframe timeframe.
🔭 On the 1H timeframe for Ethereum, we can see that after yesterday’s news, ETH pushed upward toward the top of its range but failed to break out. From that resistance, it faced a heavy rejection, and this drop happened within just two 1H candles! At the moment, ETH is in a consolidation zone, and breaking out of this compression could provide us with an entry.
⛏ The key RSI oscillator levels are at 38 and 50. Once RSI breaks above or below these zones, Ethereum could start its next move following the effects of yesterday’s NFP news.
💰 The size and volume of red candles have increased sharply, showing strong selling pressure. The corrective bounce happened step by step, but then another fairly large red 1H candle was printed. With continued selling pressure, Ethereum may test lower price levels.
💡 The alert zones for Ethereum itself are at 4,272$ and 4,338$. If either of these levels is broken, ETH could start a strong move, especially considering the momentum after yesterday’s NFP News.
❤️ Disclaimer : This analysis is purely based on my personal opinion and I only trade if the stated triggers are activated .
join our Telegram channel for more insightful and educational content .
t.me/satoshiframe
t.me/satoshiframe
Related publications
Disclaimer
The information and publications are not meant to be, and do not constitute, financial, investment, trading, or other types of advice or recommendations supplied or endorsed by TradingView. Read more in the Terms of Use.