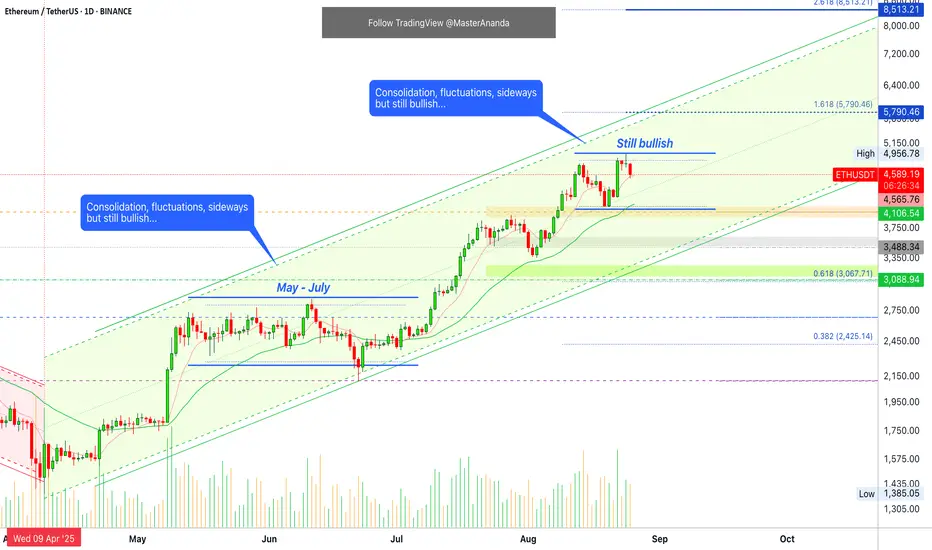
I see Ethereum and I look at Ethereum and all I see is rising prices. I can see the potential for a retrace and the bearish signals short-term but still, all I see is rising prices and a rising trend, it will continue.
Here we have a very strong rising trend and it seems Ether is peaking. There was a high 10 days ago and now we are seeing a double-top. Yesterday was a new all-time high and the candle ended with a small real body and large upper wick. This can be read as bearish but also as resistance being challenged.
Trading volume is standard for a continuation. All general signals are bullish. The trend is bullish. The market tendencies are bullish. The sentiment is bullish, etc.
Between May and July we had a period of sideways action, two months. Something similar can happen but instead of two months, two weeks or four weeks. I believe this one will be shorter than the last.
Prices can drop just to recover the next day. Prices can continue rising without a drop. It is hard to predict the very short-term.
Ethereum is bullish on all timeframes and no signals point to a top being present.
The day with high bearish volume 14-August was matched by a day of high bullish volume 22-August. So the market remains positive on the upside. The market bias continues bullish.
Ethereum is bullish long-term, and we expect to continue rising as long as the action is happening above $4,100. If it moves below, we will rethink.
Thank you for reading.
Namaste.
Trade active
Ether UpdateChart:
Consider the bigger picture. Look at this chart and see the rising channel.
When focused on the small picture a drop lasting only three days is a bear market, the end of the world or a "correction." When focusing on the bigger picture three days red is nothing, we can act and react when prices move beyond a certain point.
If Ether is trading above $4,100, it is simply just too strong. It doesn't matter if it goes red one day or two days, it is going up. The price is actually $4,600 right now, so wow!. Imagine, everything looks great.
Look at the chart again and notice we have a rising trend, the rising channel in green. Then look at the EMAs. EMA34 is at $4,123. See MA200 (black).
Ok, we grow.
Everything continues bullish.
Namaste.
🚨 LIFETIME (Pay for 7, get 1)
lamatrades.com —Since 2017
🚨 Results
ETH +2150%
CRO +1272%
AAVE +1134%
XRP +749%
DOGS +868%
SOL +687%
BTC +580%
t.me/anandatrades/1350
🚨 Analyses & Results
t.me/masteranandatrades/6681
lamatrades.com —Since 2017
🚨 Results
ETH +2150%
CRO +1272%
AAVE +1134%
XRP +749%
DOGS +868%
SOL +687%
BTC +580%
t.me/anandatrades/1350
🚨 Analyses & Results
t.me/masteranandatrades/6681
Related publications
Disclaimer
The information and publications are not meant to be, and do not constitute, financial, investment, trading, or other types of advice or recommendations supplied or endorsed by TradingView. Read more in the Terms of Use.
