Chart Overview:
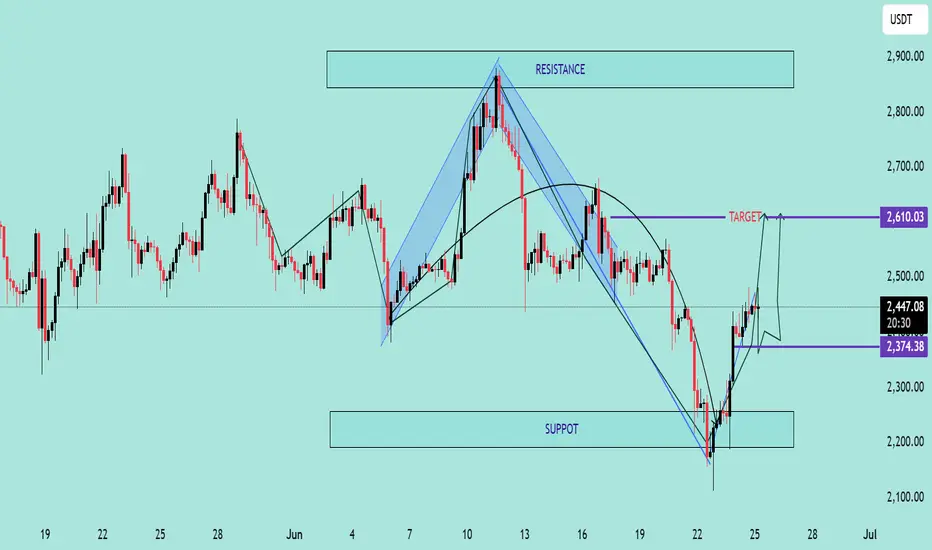
Ethereum (ETH) has shown a strong bullish reversal from the support zone near $2,200, forming a V-shaped recovery pattern. The price is currently trading around $2,450, with upward momentum targeting the next key resistance level.
📌 Key Technical Highlights:
✅ Support Zone:
Clearly respected at $2,200 – $2,300 range
Multiple candle wicks suggest strong buyer interest
✅ Resistance Zone:
Major resistance expected around $2,900
Historical rejection indicates potential selling pressure
✅ Target Level:
Short-term target marked at $2,610 🟣
If momentum sustains, price could push towards this zone before facing resistance
📈 Bullish Momentum:
Strong breakout from downtrend channel
Formation of higher highs and higher lows
Price action respecting upward trend structure
🛠 Pattern Structure:
Reversal pattern after corrective phase
Bullish engulfing candles suggest continuation
📊 Forecast Path:
Two potential scenarios are outlined:
📈 A clean push to the $2,610 target, followed by consolidation
🔄 A short pullback to $2,374 before continuation to the target
⚠️ Conclusion:
ETH/USDT is showing bullish signs with potential to reach $2,610. Watch for consolidation or pullbacks as buying opportunities, but be cautious of heavy resistance above $2,900. Ideal for short- to mid-term bullish setups
JOIN MY TELEGRAM CHANNEL
t.me/StellarMarketAnalysis
JOIN MY RECOMMENTED BROKER REFFREL LINK
⤵️one.exnesstrack.net/a/uvd1etcgg1
PARTNER CODE⤵️
uvd1etcgg1
t.me/StellarMarketAnalysis
JOIN MY RECOMMENTED BROKER REFFREL LINK
⤵️one.exnesstrack.net/a/uvd1etcgg1
PARTNER CODE⤵️
uvd1etcgg1
Disclaimer
The information and publications are not meant to be, and do not constitute, financial, investment, trading, or other types of advice or recommendations supplied or endorsed by TradingView. Read more in the Terms of Use.