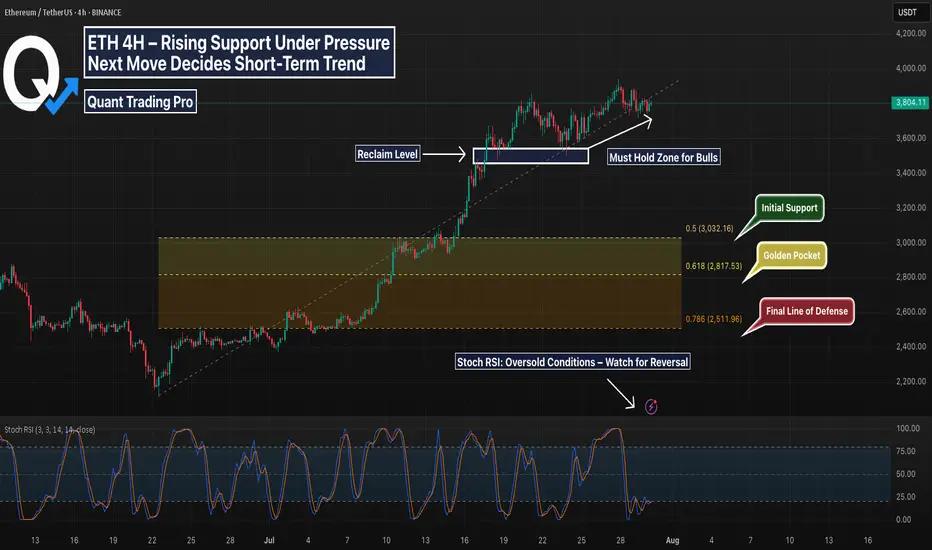
Ethereum’s 4H chart shows price compressing against rising trendline support after a strong impulse move in July. While bulls have defended the key reclaim zone (white box) multiple times, momentum is fading and structure is at risk.
Price is now coiling just above the diagonal trendline — a decisive bounce here could spark continuation. However, a breakdown opens the door to deeper retracements.
Key Fib retracement levels below:
0.5 at $3,032 – Initial reaction zone
0.618 (Golden Pocket) at $2,817 – High confluence support
0.786 at $2,511 – Extreme retracement target
The Stoch RSI is deeply oversold, suggesting a bounce may be near — but confirmation is needed.
📊 Things to watch:
Reaction at trendline support
Sweep of reclaim zone followed by reclaim
Golden Pocket retest with bullish divergence
If support holds, this could be a textbook higher low. If not, expect liquidity hunts toward the fib zones. Stay nimble.
Perfect candidate for a strategy backtest or reactive plan using alerts and confirmation tools.
Try our strategy optimizer at quanttradingpro.com
Developing free strategies weekly stay tuned...
Join our discord discord.gg/2systG9frc
We provide education & tools.
Developing free strategies weekly stay tuned...
Join our discord discord.gg/2systG9frc
We provide education & tools.
Disclaimer
The information and publications are not meant to be, and do not constitute, financial, investment, trading, or other types of advice or recommendations supplied or endorsed by TradingView. Read more in the Terms of Use.