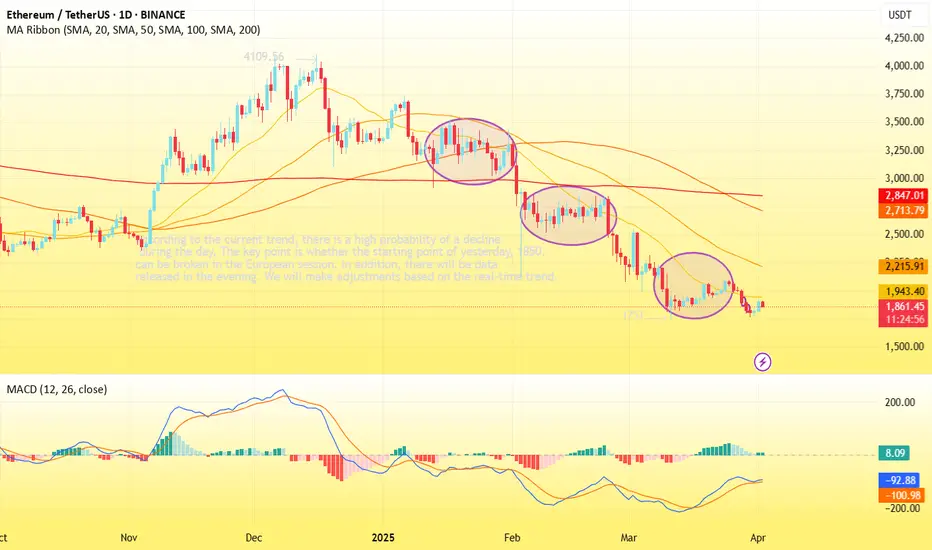
Technical analysis of ETH contract on April 2: Today, the large-cycle daily level closed with a small positive line yesterday, and the K-line pattern was a single positive line with continuous negatives. The price was at a low level, and the attached indicator was a golden cross with a shrinking volume, but it can be seen that the fast and slow lines are still below the zero axis, which is an obvious price suppression, and the current pullback trend is only a correction performance, which is difficult to continue and difficult to break. This is the signal, so the downward trend remains unchanged; the correction trend of the four-hour chart for two consecutive trading days is also completed. At present, the K-line pattern is continuous negative, and the price is under pressure and retreats. Whether the European session can break down is very critical. The short-cycle hourly chart of the previous day's US session hit a high in the early morning and retreated under pressure in the morning. The current K-line pattern is a continuous negative and the attached indicator is dead cross running. It is still bearish during the day. The starting point is near the 1850 area. The European session depends on the breakout of this position.
Therefore, today's ETH short-term contract trading strategy: sell at the pullback 1900 area, stop loss at the 1930 area, and target the 1820 area;
Therefore, today's ETH short-term contract trading strategy: sell at the pullback 1900 area, stop loss at the 1930 area, and target the 1820 area;
Disclaimer
The information and publications are not meant to be, and do not constitute, financial, investment, trading, or other types of advice or recommendations supplied or endorsed by TradingView. Read more in the Terms of Use.
Disclaimer
The information and publications are not meant to be, and do not constitute, financial, investment, trading, or other types of advice or recommendations supplied or endorsed by TradingView. Read more in the Terms of Use.