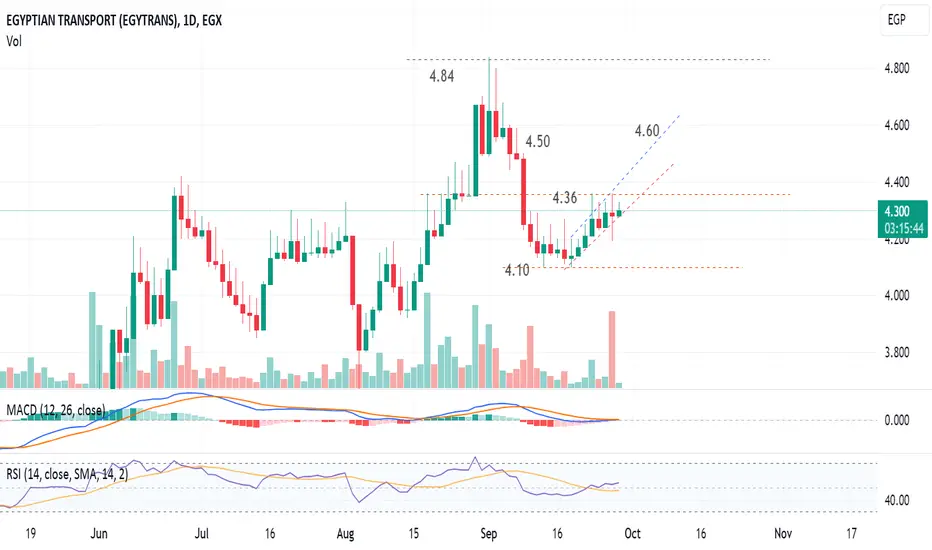
Daily chart, the stock  ETRS dropped from 4.84 to 4.10 and renounced to 4.30
The technical indicators RSI and MACD are telling the price will soon go to 4.50 extendable to 4.60
Note that 4.36 level is a resistance and there may be some fluctuation around this level; before resuming upwards.
Stop loss below 4.25 should be considered
The technical indicators RSI and MACD are telling the price will soon go to 4.50 extendable to 4.60
Note that 4.36 level is a resistance and there may be some fluctuation around this level; before resuming upwards.
Stop loss below 4.25 should be considered
Trade active
typo correction: * rebounced to 4.30Accumulation in the range 4.26 - 4.31
Disclaimer
The information and publications are not meant to be, and do not constitute, financial, investment, trading, or other types of advice or recommendations supplied or endorsed by TradingView. Read more in the Terms of Use.
Disclaimer
The information and publications are not meant to be, and do not constitute, financial, investment, trading, or other types of advice or recommendations supplied or endorsed by TradingView. Read more in the Terms of Use.