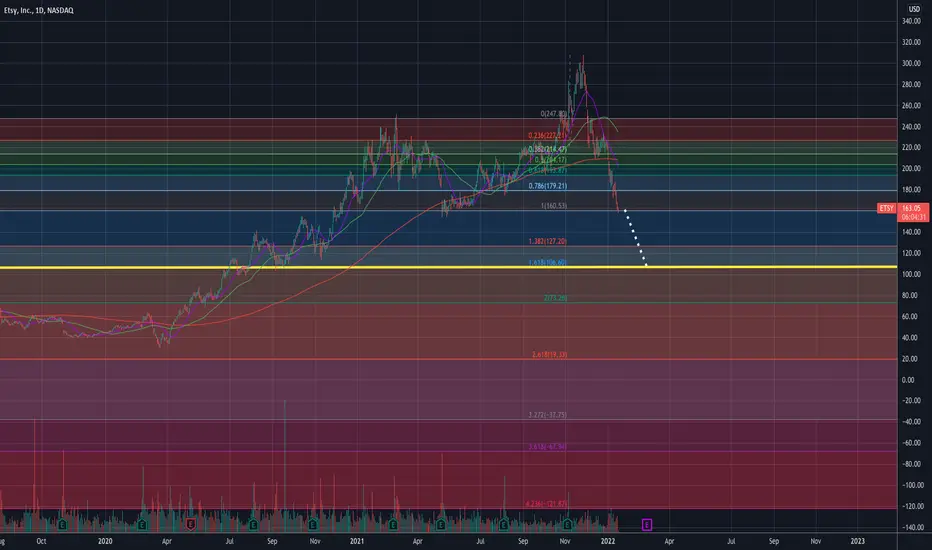
Shares has been cut almost in half and RSI shows it is oversold. It could see near term technical bounce. The bounce may not get pass $179.
$160 level is critical support and if that fails, the price could fall to $106 - $100 area with $127 being intermediate support.
There will be a lot of stop loss settings right below $160 area as it's an obvious support level. Why? Because, traders us strong support level as an area where they set stop losses.
Bullish target - $179
Bearish Target 1 - $127
Bearish Target 2 - $106
Sitting on side lines.
———————————————————
How to read my charts?
- Matching color trend lines shows the pattern. Sometimes a chart can have multiple patterns. Each pattern will have matching color trend lines.
- The yellow horizontal lines shows support and resistance areas.
- Fib lines also shows support and resistance areas.
- The dotted white lines shows price projection for breakout or breakdown target.
Disclaimer: Do your own DD. Not an investment advice.
I am not a licensed professional. None of the posts that I published are investment advice. Do your own research.
Disclaimer
The information and publications are not meant to be, and do not constitute, financial, investment, trading, or other types of advice or recommendations supplied or endorsed by TradingView. Read more in the Terms of Use.