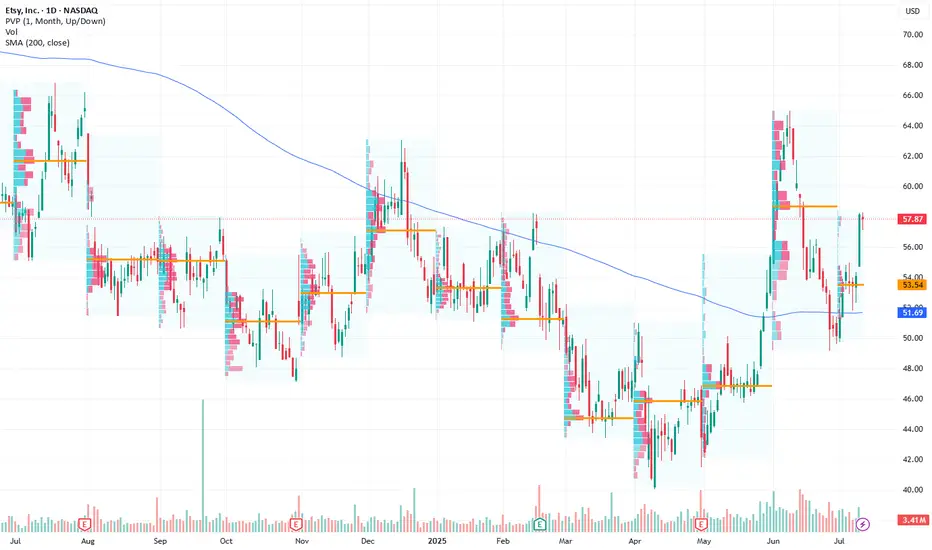
Current Price: $57.87
Direction: LONG
Targets:
- T1 = $60.50
- T2 = $64.00
Stop Levels:
- S1 = $56.00
- S2 = $54.50
**Wisdom of Professional Traders:**
This analysis synthesizes insights from thousands of professional traders and market experts, leveraging collective intelligence to identify high-probability trade setups. The wisdom of crowds principle suggests that aggregated market perspectives from experienced professionals often outperform individual forecasts, reducing cognitive biases and highlighting consensus opportunities in Etsy.
**Key Insights:**
Etsy has broken out of a descending wedge pattern, a bullish technical indicator that frequently signifies the end of a downturn and a shift in market sentiment. This breakout is complemented by a “golden cross” formation, where a short-term moving average crosses above its long-term counterpart, often associated with sustained bullish trends. These technical patterns, paired with increasing volume during the breakout, indicate growing investor confidence and the potential for significant upward momentum in the near term.
The company’s niche focus on craft-based e-commerce positions it well amid trends favoring small business support and unique products, adding further long-term growth potential. Recent volume-weighted metrics also show positive divergence, signaling underlying demand even during market-wide hesitations.
**Recent Performance:**
Etsy has recently recovered from a multi-month decline, trading at $57.87 after forming a strong support base around $54. This recovery has been marked by increasingly higher lows and higher highs, confirming the presence of an uptrend. The breakout from its descending wedge pattern was accompanied by above-average trading volume, underscoring market conviction in the move.
**Expert Analysis:**
Analysts are optimistic about the breakout’s implications, citing the combination of technical indicators that suggest Etsy is entering a bullish zone. A short-term target range between $60 and $64 aligns with Fibonacci retracement levels from prior downturns, while a long-term price objective could extend significantly higher if the upward trajectory sustains. The golden cross and robust RSI levels further validate a bullish stance, suggesting that momentum is far from peaking.
**News Impact:**
No major news headlines have directly driven Etsy’s recent movements, but broader macroeconomic factors, such as holiday season spending increases and potential improvements in consumer sentiment, could provide additional tailwinds. Furthermore, Etsy’s unique marketplace offering remains a draw for consumers even amid economic uncertainty, which could shield it from industry-specific headwinds.
**Trading Recommendation:**
With Etsy showing clear signs of bullish momentum and technical breakout patterns, a long position is recommended for traders seeking short- to medium-term gains. The initial target at $60.50 and the secondary target at $64.00 present attractive profit areas, while stop levels at $56.00 and $54.50 provide ample downside protection. This trade setup is supported by the confluence of technical signals, recent performance trends, and the company’s stable market positioning.
Disclaimer
The information and publications are not meant to be, and do not constitute, financial, investment, trading, or other types of advice or recommendations supplied or endorsed by TradingView. Read more in the Terms of Use.
Disclaimer
The information and publications are not meant to be, and do not constitute, financial, investment, trading, or other types of advice or recommendations supplied or endorsed by TradingView. Read more in the Terms of Use.