EUR/AUD Technical Analysis
📊 EUR/AUD Technical Analysis – Bullish Reversal Setup
🔹 Market Structure Insight:
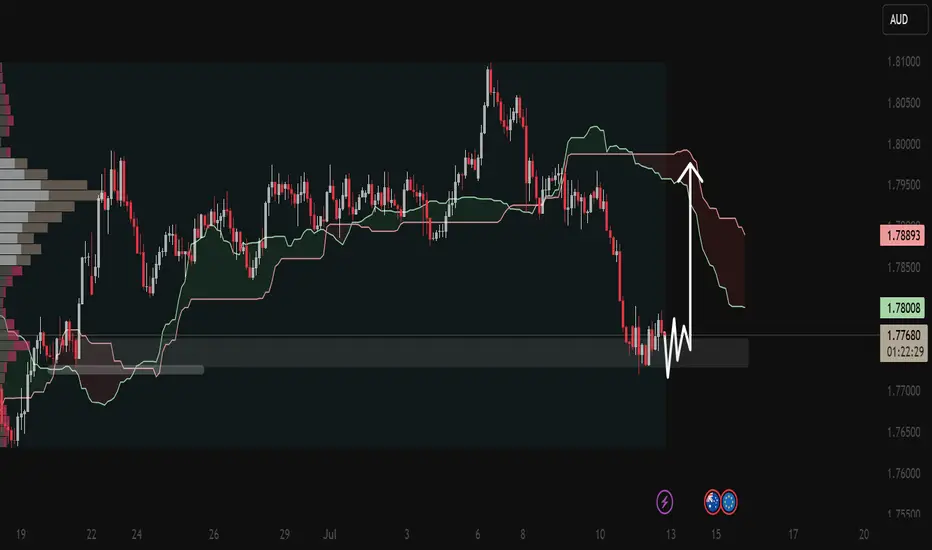
Current Price: 1.77671
The chart indicates a sharp downtrend that has started to base out, showing early signs of potential bullish reversal.
Price is forming a rounded bottom / small accumulation range after a heavy selloff.
🔍 Key Technical Points:
Bearish Exhaustion Detected:
Strong downward leg from ~1.8000 to ~1.7750.
Selling pressure is fading, evident by smaller candles and wicks on both sides.
Momentum loss is a common precursor to reversal or retracement.
Support Formation Zone:
Price is stabilizing around a prior demand zone (1.7740–1.7760 area).
Multiple candle rejections indicate buyers are absorbing sell pressure.
Projected Bullish Move:
White arrow suggests breakout from micro-consolidation.
If price breaks above 1.7800, it could rally toward 1.7900–1.7950 short-term resistance.
A breakout could be news-driven—watch for events on July 15 (AUD & EUR news icons visible).
🎯 Trade Setup (Pro Approach):
Component Detail
Buy Entry Break and close above 1.7800
Stop Loss Below 1.7730 (recent swing low)
TP1 1.7880 (minor structure resistance)
TP2 1.7940–1.7960 (key resistance zone)
Bias Shift Bearish below 1.7720
✅ Summary:
"EUR/AUD has completed a sharp sell-off and is now forming a base, signaling bearish exhaustion. A bullish breakout from this tight consolidation zone could trigger a recovery rally, targeting 1.79+. Upcoming fundamentals may serve as the catalyst for this move. Patience and confirmation are key."
📊 EUR/AUD Technical Analysis – Bullish Reversal Setup
🔹 Market Structure Insight:
Current Price: 1.77671
The chart indicates a sharp downtrend that has started to base out, showing early signs of potential bullish reversal.
Price is forming a rounded bottom / small accumulation range after a heavy selloff.
🔍 Key Technical Points:
Bearish Exhaustion Detected:
Strong downward leg from ~1.8000 to ~1.7750.
Selling pressure is fading, evident by smaller candles and wicks on both sides.
Momentum loss is a common precursor to reversal or retracement.
Support Formation Zone:
Price is stabilizing around a prior demand zone (1.7740–1.7760 area).
Multiple candle rejections indicate buyers are absorbing sell pressure.
Projected Bullish Move:
White arrow suggests breakout from micro-consolidation.
If price breaks above 1.7800, it could rally toward 1.7900–1.7950 short-term resistance.
A breakout could be news-driven—watch for events on July 15 (AUD & EUR news icons visible).
🎯 Trade Setup (Pro Approach):
Component Detail
Buy Entry Break and close above 1.7800
Stop Loss Below 1.7730 (recent swing low)
TP1 1.7880 (minor structure resistance)
TP2 1.7940–1.7960 (key resistance zone)
Bias Shift Bearish below 1.7720
✅ Summary:
"EUR/AUD has completed a sharp sell-off and is now forming a base, signaling bearish exhaustion. A bullish breakout from this tight consolidation zone could trigger a recovery rally, targeting 1.79+. Upcoming fundamentals may serve as the catalyst for this move. Patience and confirmation are key."
Forex Market Analyst | XAU/USD Specialist
. VIP Signal Channel for Premium Insights
. Comprehensive Forex Mentorship Program
. Affiliate Program for growth-driven partners
Join Our Telegram t.me/Goldsignalspro12
. VIP Signal Channel for Premium Insights
. Comprehensive Forex Mentorship Program
. Affiliate Program for growth-driven partners
Join Our Telegram t.me/Goldsignalspro12
Disclaimer
The information and publications are not meant to be, and do not constitute, financial, investment, trading, or other types of advice or recommendations supplied or endorsed by TradingView. Read more in the Terms of Use.