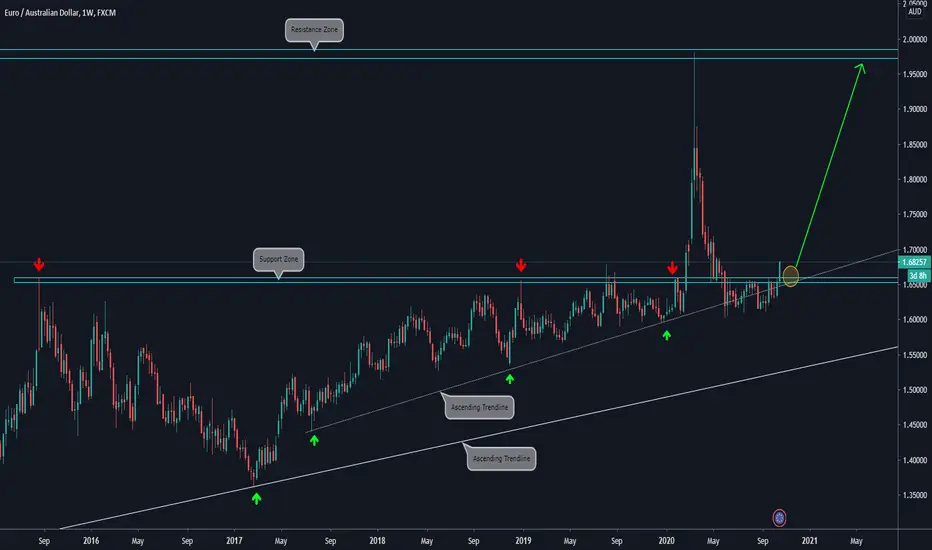
🔸WEEKLY CHART EXPLANATION:
.
.
🔸Price tried to break the Ascending Trendline but it could not make a downside move.
.
🔸Instead, we can see that the current candle is breaking the Resistance Zone (now Support Zone).
.
🔸In the long term, we consider that price has potential to make an upside move towards the Resistance Zone.
.
🔸 Will look for a lower timeframe bullish setup.
.
.
🔸Price tried to break the Ascending Trendline but it could not make a downside move.
.
🔸Instead, we can see that the current candle is breaking the Resistance Zone (now Support Zone).
.
🔸In the long term, we consider that price has potential to make an upside move towards the Resistance Zone.
.
🔸 Will look for a lower timeframe bullish setup.
Disclaimer
The information and publications are not meant to be, and do not constitute, financial, investment, trading, or other types of advice or recommendations supplied or endorsed by TradingView. Read more in the Terms of Use.
Disclaimer
The information and publications are not meant to be, and do not constitute, financial, investment, trading, or other types of advice or recommendations supplied or endorsed by TradingView. Read more in the Terms of Use.