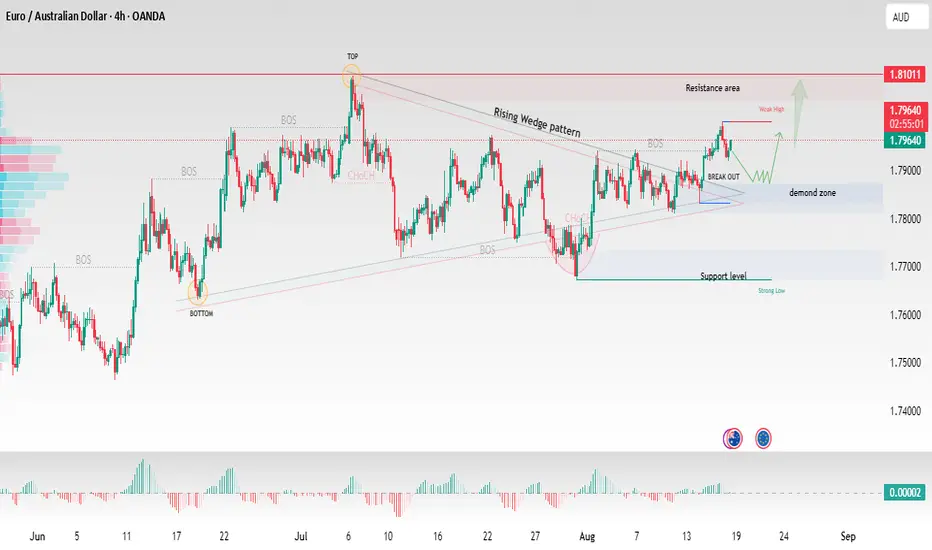
On the 4H chart, EUR/AUD has recently broken out from a rising wedge pattern after retesting the demand zone around 1.7800–1.7850. Price action shows a strong bullish attempt while holding above key support levels.
Key points from the structure:
Rising wedge pattern followed by a breakout confirmation.
Strong demand zone support near 1.7800, aligning with previous BOS levels.
Current resistance lies around 1.8000–1.8100, which remains the next target for bulls.
If demand holds, a bullish continuation toward 1.8100 resistance area is possible.
On the other hand, a break back below 1.7800 may weaken momentum and expose the 1.7700 support zone.
This setup highlights both bullish breakout opportunities and risk of pullback, making the upcoming sessions crucial for directional confirmation.
This post is for educational purposes only, not financial advice. Always use proper risk management and follow your trading plan.
$ FOREX / GOLD / BTC | Real Trades,Real Result | Risk-managed strategiesn &VIP Signal {My Personal Entries} Join Telegram _ Trade smater ||
📬 Join Free Channel:
t.me/profitmagnetpro12
📬 Join Free Channel:
t.me/profitmagnetpro12
Disclaimer
The information and publications are not meant to be, and do not constitute, financial, investment, trading, or other types of advice or recommendations supplied or endorsed by TradingView. Read more in the Terms of Use.