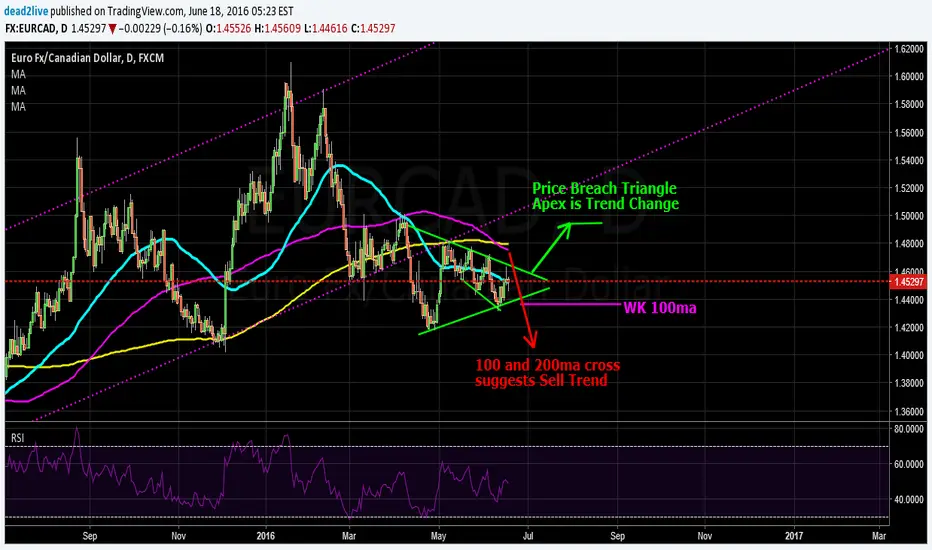
EURCAD D1
Symmetrical Triangle, break out either direction
Broadening Wedge Inside Triangle which usually Sells Off 55% (Bulkowski)
100 and 200 ma crossing suggests Down Trend
Right now price is stymied by 100ma on WK Volume needed to push lower.
Price resistance above by 50 ma. Volume needed to move lower.
Historically in downtrends price remains below 50ma giving more rise to short bias.
Sell Signal: When Daily closes outside of trendline on triangle.
I believe this price action is representative of the weekly changing trend direction
and creating a new channel. Hence, the broadening wedge.
She's most likely a sell at the appropriate time
Disclaimer
The information and publications are not meant to be, and do not constitute, financial, investment, trading, or other types of advice or recommendations supplied or endorsed by TradingView. Read more in the Terms of Use.
Disclaimer
The information and publications are not meant to be, and do not constitute, financial, investment, trading, or other types of advice or recommendations supplied or endorsed by TradingView. Read more in the Terms of Use.