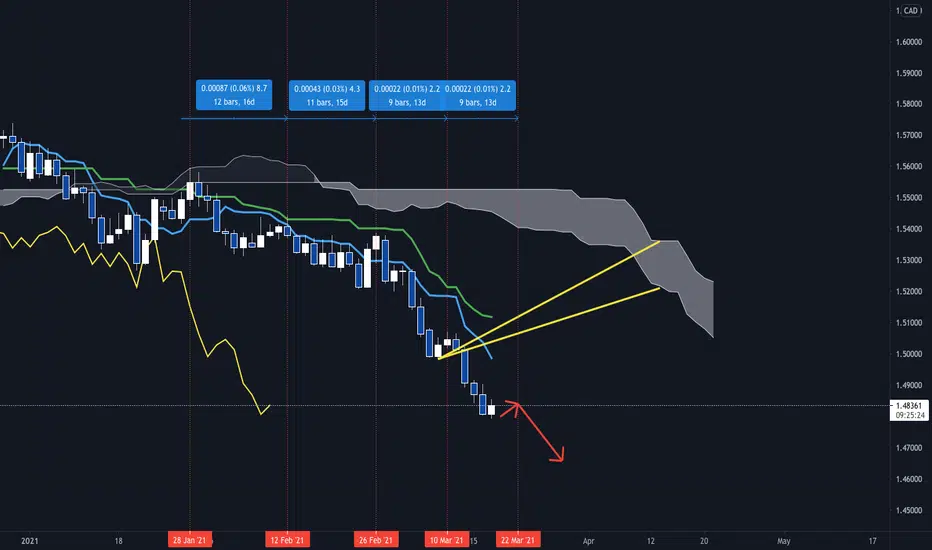
EURCAD Daily chart shows a continuous downtrend by below Ichimoku confirmations.
- Kumo (Senko span A and B) down
- Kijun sen down
- Tenkan sen down
- Chiko span below candles
After breakout of the forecast lines market has been continuously downtrending.
In terms of the time cycle the previous highs are in 9 candles, which is one of the Kihon Suchi numbers. Therefore next Henka-bi can be on 22 Mar.
Note
Please refer to a video for further explanation.youtu.be/m08fdGvuipQ
Forex Kei
Official Website: forex-kei.com
Global Trading School: forex-kei.com/?page_id=2855
KTS Academy: keistradingstrategy.com
Official Website: forex-kei.com
Global Trading School: forex-kei.com/?page_id=2855
KTS Academy: keistradingstrategy.com
Disclaimer
The information and publications are not meant to be, and do not constitute, financial, investment, trading, or other types of advice or recommendations supplied or endorsed by TradingView. Read more in the Terms of Use.