Hello my friends,
I sometimes switch to line chart for a better perspective in drawing lines. It eliminate many noises and only focusing on candle close.
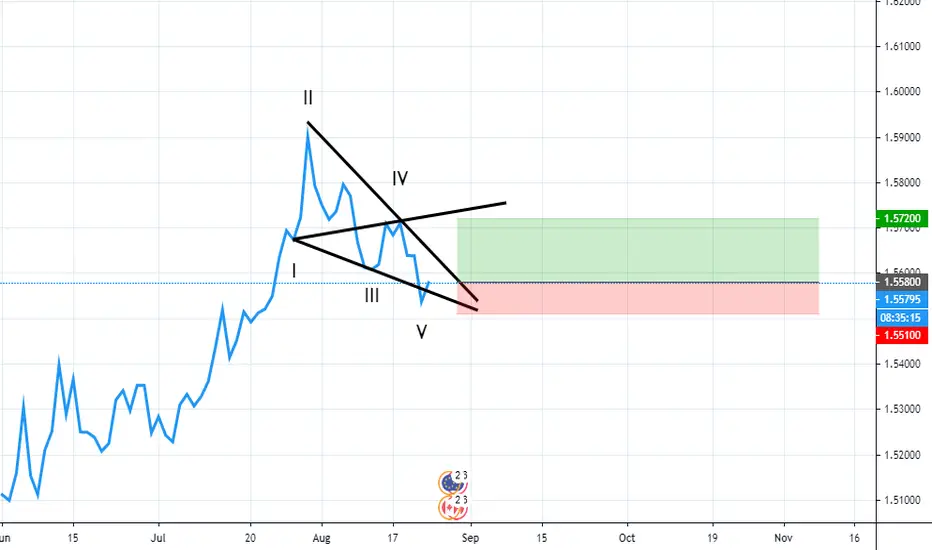
EURCAD making a nice falling wedge / wolfe wave pattern at daily timeframe in my opinion right now. Price are bullish and moving inside the line i marked. Yesterday candle / friday candle closing below it which could be a false break as today price come back inside the marked area.
I am buying EURCAD 1.5580
Stop loss 1.5510
Take profit 1 @1.5650
Take profit 2 @1.5720
Use only 1-2% risk
Good Luck
I sometimes switch to line chart for a better perspective in drawing lines. It eliminate many noises and only focusing on candle close.
EURCAD making a nice falling wedge / wolfe wave pattern at daily timeframe in my opinion right now. Price are bullish and moving inside the line i marked. Yesterday candle / friday candle closing below it which could be a false break as today price come back inside the marked area.
I am buying EURCAD 1.5580
Stop loss 1.5510
Take profit 1 @1.5650
Take profit 2 @1.5720
Use only 1-2% risk
Good Luck
Disclaimer
The information and publications are not meant to be, and do not constitute, financial, investment, trading, or other types of advice or recommendations supplied or endorsed by TradingView. Read more in the Terms of Use.
Disclaimer
The information and publications are not meant to be, and do not constitute, financial, investment, trading, or other types of advice or recommendations supplied or endorsed by TradingView. Read more in the Terms of Use.