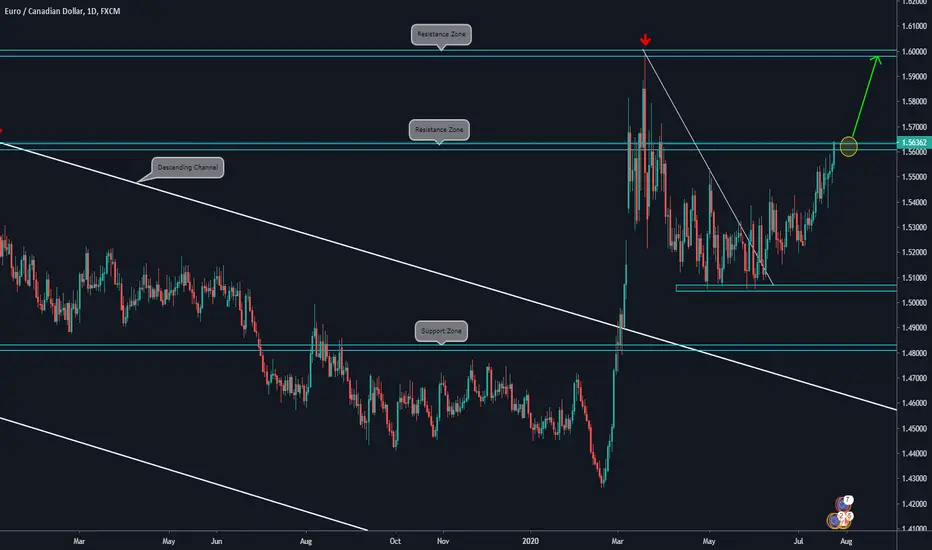
🔸 DAILY CHART EXPLANATION:
.
.
🔸Price broke the Daily Structure, and it is making higher lows and higher highs.
.
🔸It is facing the Resistance Zone.
.
🔸If it breaks to the upside, then it has potential to reach the next Resistance Zone.
.
🔸 Will look for a lower timeframe bullish setup.
🔸 WEEKLY CHART ANALYSIS:

.
.
🔸Price broke the Daily Structure, and it is making higher lows and higher highs.
.
🔸It is facing the Resistance Zone.
.
🔸If it breaks to the upside, then it has potential to reach the next Resistance Zone.
.
🔸 Will look for a lower timeframe bullish setup.
🔸 WEEKLY CHART ANALYSIS:
Disclaimer
The information and publications are not meant to be, and do not constitute, financial, investment, trading, or other types of advice or recommendations supplied or endorsed by TradingView. Read more in the Terms of Use.
Disclaimer
The information and publications are not meant to be, and do not constitute, financial, investment, trading, or other types of advice or recommendations supplied or endorsed by TradingView. Read more in the Terms of Use.