✅ Why This Could Be the Next Move
1. Wave Structure Integrity
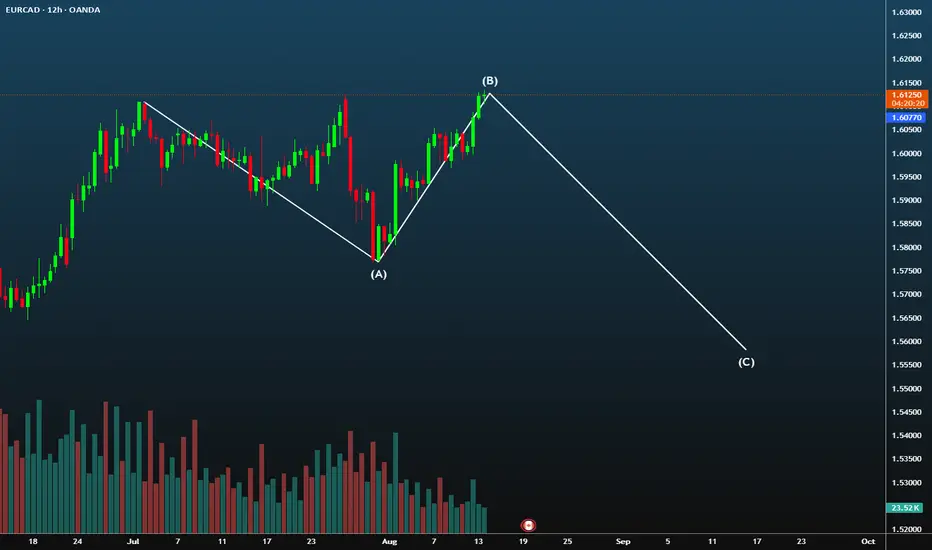
- If the current price action shows a completed Wave A (impulsive down) and Wave B (corrective up), then Wave C is likely next.
- Wave C typically mirrors Wave A in length and momentum — a classic zigzag.
2. Market Context
- If EURCAD recently hit resistance near 1.68–1.69 and failed to break higher, that’s a textbook B-wave top.
- The current price at 1.67736 suggests it’s hovering near the B peak — ripe for reversal.
3. Momentum Divergence
- If MACD or RSI shows bearish divergence at B, it signals weakening bullish momentum — a precursor to Wave C.
- Your MACD Tango logic could confirm this with a fading histogram and apex crossover.
4. Fibonacci Confluence
- If Wave B retraced ~61.8% of Wave A, and price is now rejecting that level, it’s a strong signal.
- You can project Wave C using the 100% or 127.2% extension of Wave A from B — a common Elliott target.
5. Volume & Volatility
- If volume peaked during Wave A and faded in Wave B, it supports the corrective nature of B.
- A sudden spike in volatility (ATR or candle % filter) could mark the start of Wave C.
🔧 How to Trade It (If Confirmed)
- Entry: Below B with confirmation (e.g., bearish engulfing or MACD crossover).
- Stop Loss: Above B, buffered by ATR.
- Take Profit: Projected C target — ideally near 1.6650 or lower, depending on Wave A length.
1. Wave Structure Integrity
- If the current price action shows a completed Wave A (impulsive down) and Wave B (corrective up), then Wave C is likely next.
- Wave C typically mirrors Wave A in length and momentum — a classic zigzag.
2. Market Context
- If EURCAD recently hit resistance near 1.68–1.69 and failed to break higher, that’s a textbook B-wave top.
- The current price at 1.67736 suggests it’s hovering near the B peak — ripe for reversal.
3. Momentum Divergence
- If MACD or RSI shows bearish divergence at B, it signals weakening bullish momentum — a precursor to Wave C.
- Your MACD Tango logic could confirm this with a fading histogram and apex crossover.
4. Fibonacci Confluence
- If Wave B retraced ~61.8% of Wave A, and price is now rejecting that level, it’s a strong signal.
- You can project Wave C using the 100% or 127.2% extension of Wave A from B — a common Elliott target.
5. Volume & Volatility
- If volume peaked during Wave A and faded in Wave B, it supports the corrective nature of B.
- A sudden spike in volatility (ATR or candle % filter) could mark the start of Wave C.
🔧 How to Trade It (If Confirmed)
- Entry: Below B with confirmation (e.g., bearish engulfing or MACD crossover).
- Stop Loss: Above B, buffered by ATR.
- Take Profit: Projected C target — ideally near 1.6650 or lower, depending on Wave A length.
Disclaimer
The information and publications are not meant to be, and do not constitute, financial, investment, trading, or other types of advice or recommendations supplied or endorsed by TradingView. Read more in the Terms of Use.
Disclaimer
The information and publications are not meant to be, and do not constitute, financial, investment, trading, or other types of advice or recommendations supplied or endorsed by TradingView. Read more in the Terms of Use.