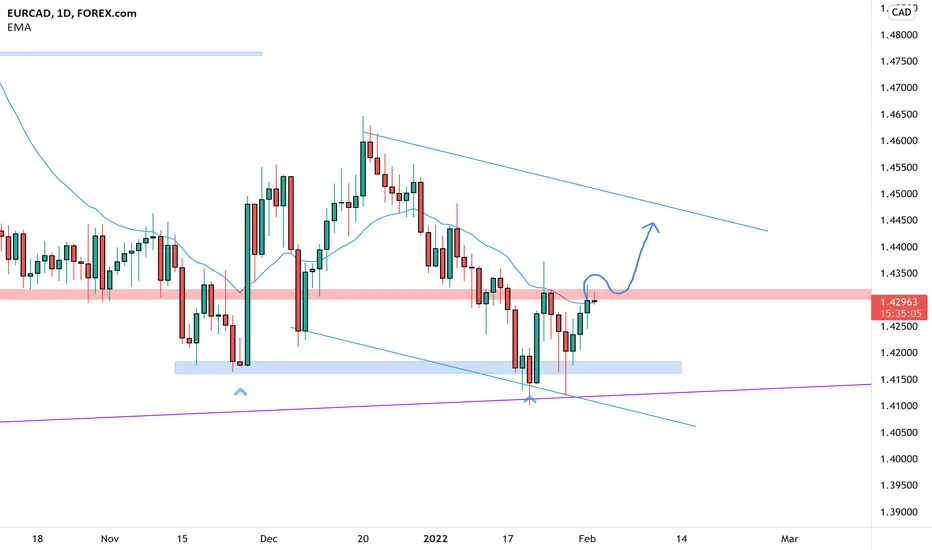
EURCAD on the daily chart reached after a long downtrend the monthly ascending trendline (purple).
The price tested it twice and create a double bottom over the daily support at the 1.41700 area.
How can we approach this scenario?
Bring a double bottom a typical inversion figure we can expect especially after a downtrend some movement to the upside.
A good confirmation of the next move can be seen in the break above the weekly resistance structure.
After the break, we will check if the price satisfies the Plancton Academy rules and set a nice long order for a good risk-return trade.
--––
Follow the Shrimp 🦐
Keep in mind.
🟣 Purple structure -> Monthly structure.
🔴 Red structure -> Weekly structure.
🔵 Blue structure -> Daily structure.
🟡 Yellow structure -> 4h structure.
⚫️ Black structure -> <4h structure.
Here is the Plancton0618 technical analysis , please comment below if you have any question.
The ENTRY in the market will be taken only if the condition of the Plancton0618 strategy will trigger.
Note
Note
Note
Note
Note
Disclaimer
The information and publications are not meant to be, and do not constitute, financial, investment, trading, or other types of advice or recommendations supplied or endorsed by TradingView. Read more in the Terms of Use.
Disclaimer
The information and publications are not meant to be, and do not constitute, financial, investment, trading, or other types of advice or recommendations supplied or endorsed by TradingView. Read more in the Terms of Use.