1.2 zone is a very important support zone. We saw some significant rallies from this zone (with the help of the Swiss bank).
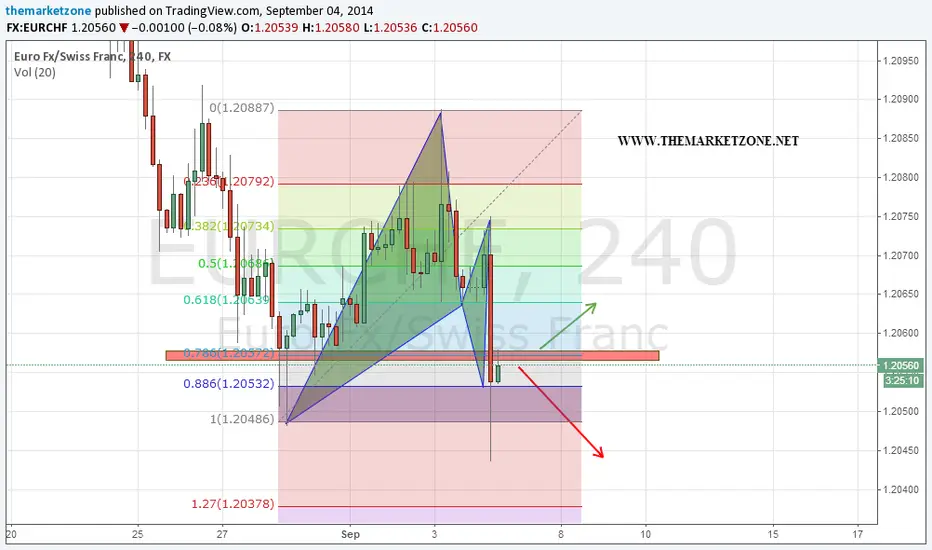
We see in the chart a harmonic pattern that the price tried to violate and failed (spike low).
The price currently is below minor resistance (red). A break above this resistance could mean the execution of the bullish pattern
1.2065 is the initial intra-day target for a bullish move.
1.208 is the second.
If the resistance hold, 1.2 is the bears target level. at 1.2 I would look for a double bottom.
Disclaimer
The information and publications are not meant to be, and do not constitute, financial, investment, trading, or other types of advice or recommendations supplied or endorsed by TradingView. Read more in the Terms of Use.
Disclaimer
The information and publications are not meant to be, and do not constitute, financial, investment, trading, or other types of advice or recommendations supplied or endorsed by TradingView. Read more in the Terms of Use.