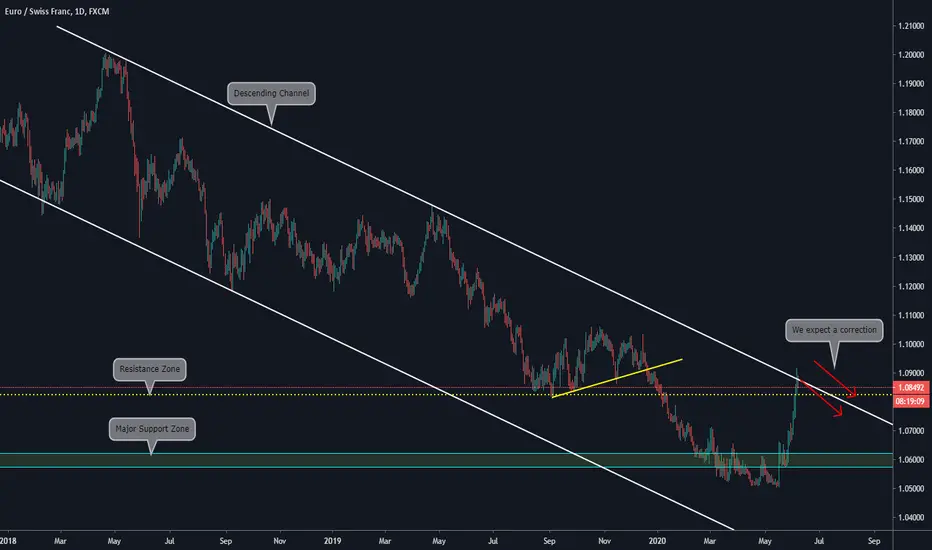
Main items we can see on the chart:
a) The price found a Huge support zone, and a reversal happened(check the Weekly Chart)
b) Currently, the price is on our previous Bullish Weekly target
c) Now we can see the price against a descending trendline
d) Before any new bullish movement, we will expect a correction on the current level
e) If that happens, we can start thinking about taking long trades
WEEKLY CHART
Disclaimer
The information and publications are not meant to be, and do not constitute, financial, investment, trading, or other types of advice or recommendations supplied or endorsed by TradingView. Read more in the Terms of Use.
Disclaimer
The information and publications are not meant to be, and do not constitute, financial, investment, trading, or other types of advice or recommendations supplied or endorsed by TradingView. Read more in the Terms of Use.