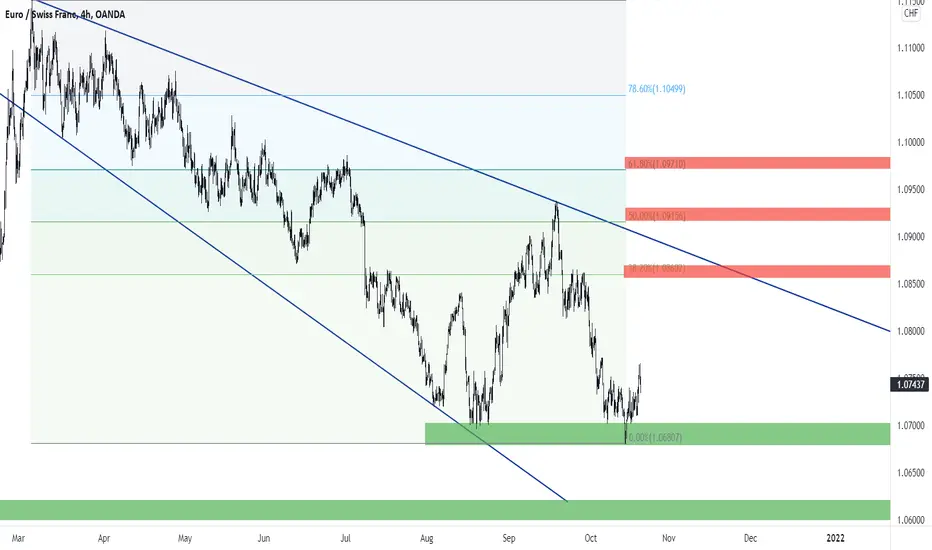
Bullish Indicators:
1) Support zone 1.06807
2) Hammer candlestick on daily
Bearish Indicators:
1) Resistance zone 1.08602 Fib level 38.20%
2) Upward descending trendline
3) Downward trend
Plan A: After forming hammer on daily its looks like the pair will move upward from here and can test the upward trendline and the resistance zone of 1.08602.
Plan B: On the downside if the the pair broke the support zone of 1.06807 the pair can move further downside towards support zone of 1.06000.
Disclaimer
The information and publications are not meant to be, and do not constitute, financial, investment, trading, or other types of advice or recommendations supplied or endorsed by TradingView. Read more in the Terms of Use.
Disclaimer
The information and publications are not meant to be, and do not constitute, financial, investment, trading, or other types of advice or recommendations supplied or endorsed by TradingView. Read more in the Terms of Use.