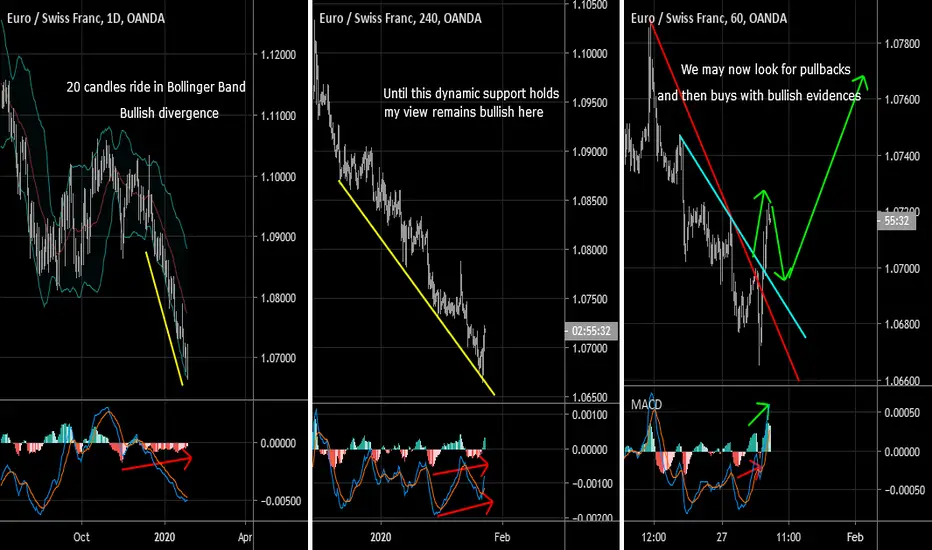
D1 - We have 20 candles ride on the lower band of the Bollinger Bands indicator, bullish divergence.
H4 - Bullish divergence, price is respecting the dynamic support, until this dynamic support holds my view remains bullish here.
H1 - Price has broken above the big and small trend line, bullish convergence.
We may now look for pullbacks to happen and then we may start looking for bullish setups with more bullish evidences (evidences could be in the form of candle stick patterns, false breaks, trend line breakout etc… supporting the bullish view) in order to start looking for the buys.
Disclaimer
The information and publications are not meant to be, and do not constitute, financial, investment, trading, or other types of advice or recommendations supplied or endorsed by TradingView. Read more in the Terms of Use.
Disclaimer
The information and publications are not meant to be, and do not constitute, financial, investment, trading, or other types of advice or recommendations supplied or endorsed by TradingView. Read more in the Terms of Use.