Hi Traders
EUR/CHF Multi-Timeframe analysis
H1 CHART ( NEUTRAL )
The market is dominated by uncertainty. The occasionally prevailing trend lasts for a limited time and changes its direction too frequently. As long as the market remains unstable, we stay aside, waiting for the market to get back on track
Support & Resistances
1.08747 1.08920
1.08521 1.09146
1.08286 1.09381
H4 CHART ( BULLISH )
Waiting for a retracement lower towards the 1.08449 support level, in order to reinstate LONG positions. Next important support is the 1.08189 level.
Support & Resistances
1.08449 1.08707
1.08189 1.09239
1.07849 1.09770
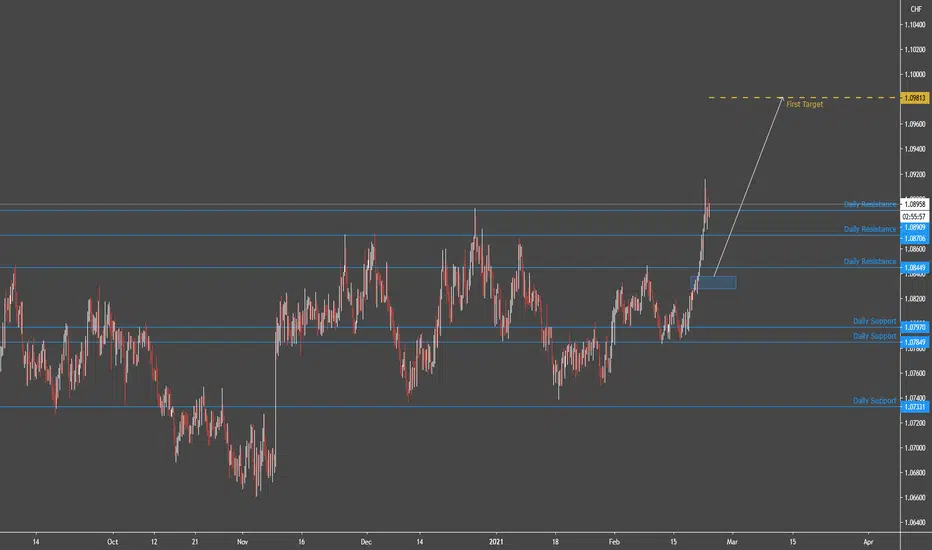
DAILY CHART ( BULLISH )
Target 1 at 1.08803 has been reached. We closed 50% of our position and have moved the stop loss at the lock-in-profits level at 1.08473 . Provided the market conditions will remain the same Target 2 will be reached soon.
Support & Resistances
1.07970 1.08449
1.07849 1.08706
1.07331 1.08909
WEEKLY CHART ( BULLISH )
A medium probability, entry signal to go LONG was given at 1.08380 after the market found support at 1.07338 . Only the downward break of 1.07338 would cancel the bullish scenario and take us SHORT.
Support & Resistances
1.07377 1.08341
1.06588 1.08909
1.05982 1.09140
EUR/CHF Multi-Timeframe analysis
H1 CHART ( NEUTRAL )
The market is dominated by uncertainty. The occasionally prevailing trend lasts for a limited time and changes its direction too frequently. As long as the market remains unstable, we stay aside, waiting for the market to get back on track
Support & Resistances
1.08747 1.08920
1.08521 1.09146
1.08286 1.09381
H4 CHART ( BULLISH )
Waiting for a retracement lower towards the 1.08449 support level, in order to reinstate LONG positions. Next important support is the 1.08189 level.
Support & Resistances
1.08449 1.08707
1.08189 1.09239
1.07849 1.09770
DAILY CHART ( BULLISH )
Target 1 at 1.08803 has been reached. We closed 50% of our position and have moved the stop loss at the lock-in-profits level at 1.08473 . Provided the market conditions will remain the same Target 2 will be reached soon.
Support & Resistances
1.07970 1.08449
1.07849 1.08706
1.07331 1.08909
WEEKLY CHART ( BULLISH )
A medium probability, entry signal to go LONG was given at 1.08380 after the market found support at 1.07338 . Only the downward break of 1.07338 would cancel the bullish scenario and take us SHORT.
Support & Resistances
1.07377 1.08341
1.06588 1.08909
1.05982 1.09140
Get my tool FREE HERE:
bit.ly/2ODALGH
FREE TELEGRAM GROUP:
bit.ly/3rYHjyd
GET MY FREE EDUCATION HERE:
bit.ly/3pQudRX
bit.ly/2ODALGH
FREE TELEGRAM GROUP:
bit.ly/3rYHjyd
GET MY FREE EDUCATION HERE:
bit.ly/3pQudRX
Disclaimer
The information and publications are not meant to be, and do not constitute, financial, investment, trading, or other types of advice or recommendations supplied or endorsed by TradingView. Read more in the Terms of Use.