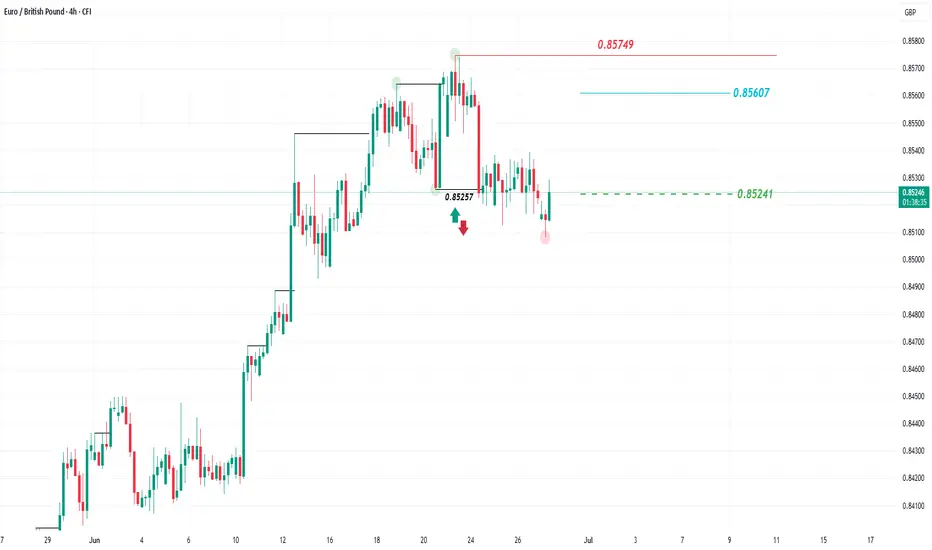
The EUR/GBP pair had been trading in a general uptrend on the 4-hour chart, forming higher highs and higher lows, until the recent pullback on June 24, 2025. During this decline, the price broke below the last higher low located at the 0.85257 level and recorded a lower low.
This recent drop suggests the end of the uptrend on the 4-hour chart and a shift toward a downtrend.
What is the next possible move?
A rise in price toward the 0.85607 level would be considered a corrective move before another potential drop targeting the 0.85241 level.
A rise above the 0.85749 level followed by a 4-hour candle closing above it would indicate a return to the uptrend and invalidate the negative scenario mentioned above.
Disclaimer
The information and publications are not meant to be, and do not constitute, financial, investment, trading, or other types of advice or recommendations supplied or endorsed by TradingView. Read more in the Terms of Use.
Disclaimer
The information and publications are not meant to be, and do not constitute, financial, investment, trading, or other types of advice or recommendations supplied or endorsed by TradingView. Read more in the Terms of Use.