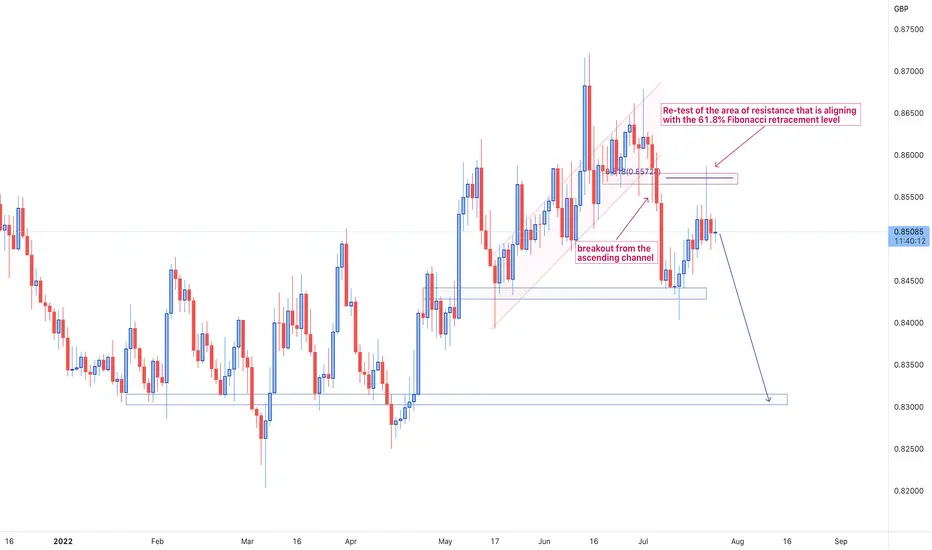
As it can be observed from the graphical illustration, after breaking out of the ascending channel plotted on the graph, the price has pushed up to re-test the broken level that lines up with the 0.618 Fibonacci retracement level. From the looks of the current price action, the price is forming a top around the local level of resistance and charging up for bearish moves.
We are looking into entering short positions and aiming for the level of support indicated on the chart.
We are looking into entering short positions and aiming for the level of support indicated on the chart.
Disclaimer
The information and publications are not meant to be, and do not constitute, financial, investment, trading, or other types of advice or recommendations supplied or endorsed by TradingView. Read more in the Terms of Use.
Disclaimer
The information and publications are not meant to be, and do not constitute, financial, investment, trading, or other types of advice or recommendations supplied or endorsed by TradingView. Read more in the Terms of Use.