📉 Overview from Weekly Timeframe
The weekly chart presents a mixed scenario. While recent price action shows bullish intent, the presence of strong resistance and the 50EMA overhead suggests limited upside potential unless a clear breakout occurs. ⚠️ Patience is needed as bias is not fully aligned.
📅 Daily Chart Explanation
The daily timeframe shows some bullish price action, but structure and EMA alignment remain bearish. This suggests that any bullish move could be short-lived unless there's a structural shift or EMA crossover to confirm momentum.
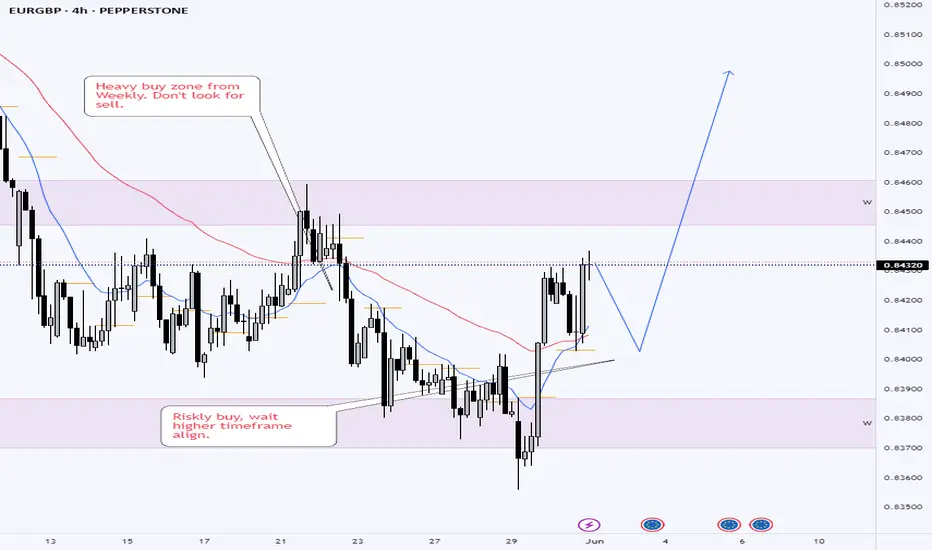
⏳ 4H Chart Explanation
The 4-hour chart shows early signs of a trend reversal — higher highs and some bullish push. However, this move is still counter-trend when compared to the higher timeframes. Risk is high as there's no confluence yet from daily or weekly charts.
📌 Plan
Bias: Cautious Bullish
Entry: Only upon clear 4H structure break + retest (with confluence from price action)
Targets:
TP1: Near recent 4H swing high
TP2: Just below weekly resistance / 50EMA zone
Invalidation: If price breaks below the recent 4H higher low, or shows bearish engulfing at resistance zone
The weekly chart presents a mixed scenario. While recent price action shows bullish intent, the presence of strong resistance and the 50EMA overhead suggests limited upside potential unless a clear breakout occurs. ⚠️ Patience is needed as bias is not fully aligned.
📅 Daily Chart Explanation
The daily timeframe shows some bullish price action, but structure and EMA alignment remain bearish. This suggests that any bullish move could be short-lived unless there's a structural shift or EMA crossover to confirm momentum.
⏳ 4H Chart Explanation
The 4-hour chart shows early signs of a trend reversal — higher highs and some bullish push. However, this move is still counter-trend when compared to the higher timeframes. Risk is high as there's no confluence yet from daily or weekly charts.
📌 Plan
Bias: Cautious Bullish
Entry: Only upon clear 4H structure break + retest (with confluence from price action)
Targets:
TP1: Near recent 4H swing high
TP2: Just below weekly resistance / 50EMA zone
Invalidation: If price breaks below the recent 4H higher low, or shows bearish engulfing at resistance zone
Disclaimer
The information and publications are not meant to be, and do not constitute, financial, investment, trading, or other types of advice or recommendations supplied or endorsed by TradingView. Read more in the Terms of Use.
Disclaimer
The information and publications are not meant to be, and do not constitute, financial, investment, trading, or other types of advice or recommendations supplied or endorsed by TradingView. Read more in the Terms of Use.