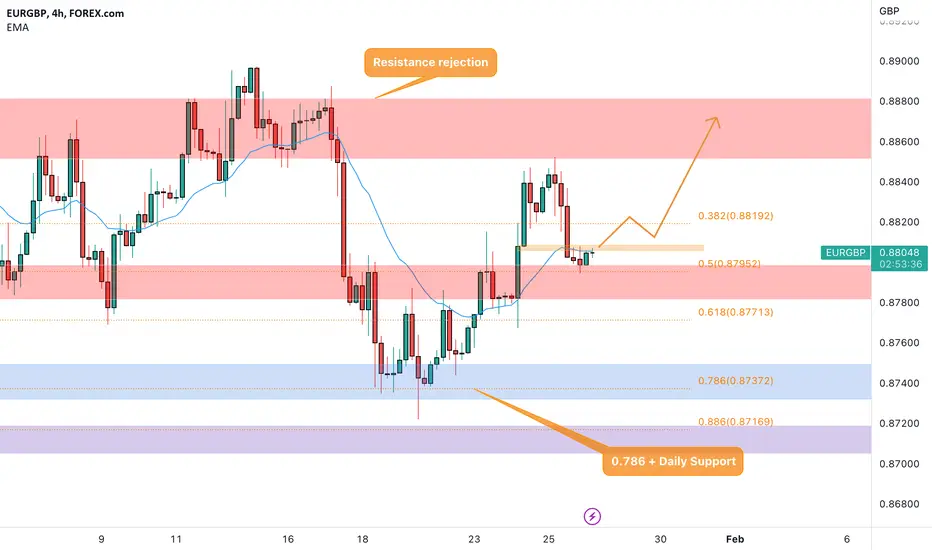
EURGBP currency pair on a 4-hour chart has dropped to the 0.786 Fibonacci level after experiencing resistance at a weekly level and then falling directly onto a daily support level.
After the drop, the market started to move upward, breaking and retesting the 50% level of the previous impulse.
This suggests that the pair may have found a new level of support and could potentially continue to move upward in the short-term.
The pair has retested the 0.5 Fibonacci level and is currently approaching a minor resistance level.
How can i approach this scenario?
If the market breaks above this resistance level, it could be considered a bullish signal and a potential opportunity for a long order according to the Plancton's strategy rules.
Note
Note
Disclaimer
The information and publications are not meant to be, and do not constitute, financial, investment, trading, or other types of advice or recommendations supplied or endorsed by TradingView. Read more in the Terms of Use.
Disclaimer
The information and publications are not meant to be, and do not constitute, financial, investment, trading, or other types of advice or recommendations supplied or endorsed by TradingView. Read more in the Terms of Use.