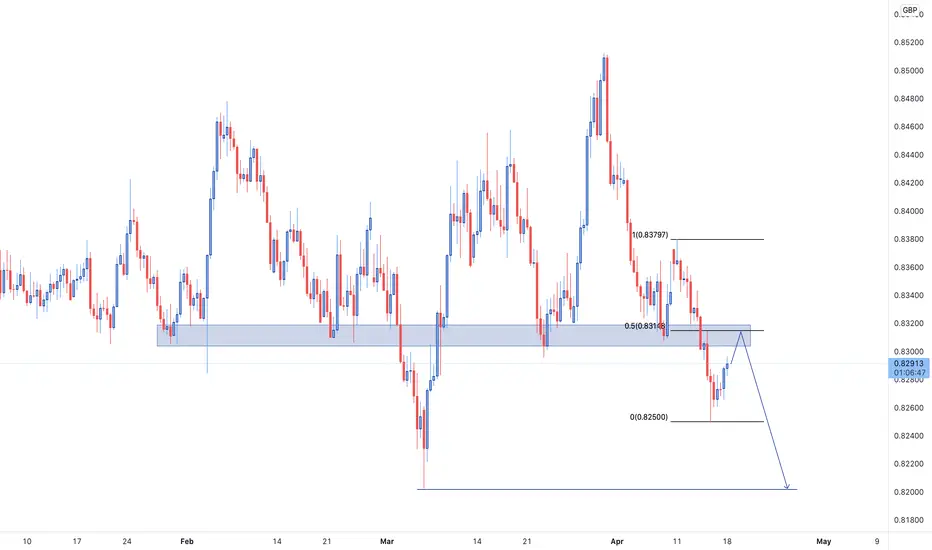
As it can be inferred from the graphical illustration, the price has been able to break below the massive zone of support plotted on the chart and finish below it. We are now expecting for the price to re-test this zone of previous support now turned resistance that lines up with 50% Fibonacci retracement level before opening possible short positions and aiming for the 0.82 area of demand.
Disclaimer
The information and publications are not meant to be, and do not constitute, financial, investment, trading, or other types of advice or recommendations supplied or endorsed by TradingView. Read more in the Terms of Use.
Disclaimer
The information and publications are not meant to be, and do not constitute, financial, investment, trading, or other types of advice or recommendations supplied or endorsed by TradingView. Read more in the Terms of Use.