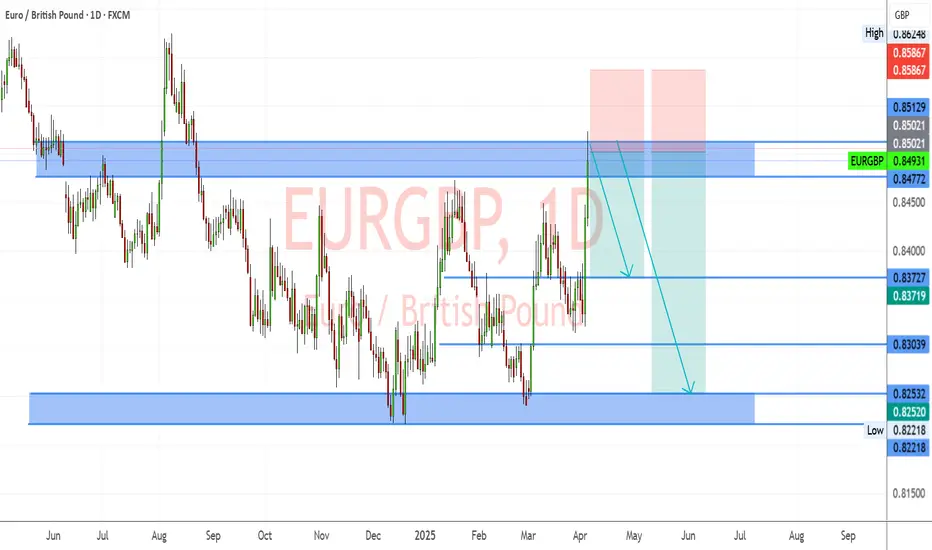
EUR/GBP daily chart reveals a compelling narrative of consolidation followed by a potential bearish reversal. The pair has been trading within a defined range, bounded by key horizontal support and resistance zones (highlighted in blue). The recent price action suggests a rejection from the upper resistance zone, setting the stage for a possible short trade.
Key Observations:
Range-Bound Consolidation: The chart clearly shows EUR/GBP oscillating within a well-defined range. This pattern indicates a period of indecision, where neither buyers nor sellers have established a clear dominant trend.
Resistance Zone Test and Rejection: The price recently revisited the upper resistance zone. The subsequent price action, characterized by a sharp downward move, suggests a strong rejection from this level. This rejection is a critical signal that sellers are stepping in, potentially reversing the recent upward momentum.
Bearish Engulfing/Pin Bar Formation (Possible): While the chart doesn't explicitly highlight a candlestick pattern, the sharp rejection from the resistance zone suggests the formation of a bearish engulfing or a pin bar on a lower timeframe. This pattern reinforces the bearish bias.
Retracement and Entry Opportunity: The price has retraced a portion of the recent decline. This retracement presents a potential opportunity to enter a short position, capitalizing on the anticipated continuation of the bearish move.
Support Zones as Targets: The lower support zone serves as a primary target for the potential short trade. The intermediate support level (around 0.83727) can act as a partial profit-taking zone or a point to trail the stop loss.
Pattern Identification:
The dominant pattern observed is a range-bound consolidation followed by a potential bearish reversal triggered by a rejection from a key resistance zone. Trade Setup:
Entry: A short entry can be considered at the current price level (around 0.85021-0.85129) or on a break below the immediate support level (0.84772). A more conservative approach would be to wait for a clear bearish candlestick pattern confirmation on a lower timeframe (e.g., H4 or H1).
Stop Loss: The stop loss should be placed above the recent swing high (around 0.85867) to protect the trade from unexpected price reversals.
Take Profit: The primary target is the lower support zone (around 0.82537-0.82218). An intermediate target can be set at the 0.83727 level.
Risk-Reward Ratio: The potential trade offers a favorable risk-reward ratio, with a relatively small stop loss and a significant profit target.
📊 Forex Signals | Free Daily Alerts
✅ 85% Accuracy | 1–2 Signals/Day
💰 Profitable Trades Sent Daily – No Cost
📲 Join Us on Telegram
t.me/ultreos_forex
🎯 Upgrade to VIP:
ultreosforex.com/
✅ 85% Accuracy | 1–2 Signals/Day
💰 Profitable Trades Sent Daily – No Cost
📲 Join Us on Telegram
t.me/ultreos_forex
🎯 Upgrade to VIP:
ultreosforex.com/
Disclaimer
The information and publications are not meant to be, and do not constitute, financial, investment, trading, or other types of advice or recommendations supplied or endorsed by TradingView. Read more in the Terms of Use.