EURHUF is not an easy cross to trade. It can be really volatile from time to time. But as a strategic game I like betting on it. Last week's price action was very interesting and based on the weekly closing I am less bullish for EURHUF now. There are not yet signals for a short trade, but may worth to do some top hunting. I put on a weekly time frame as well this time. Let's have the checklist.
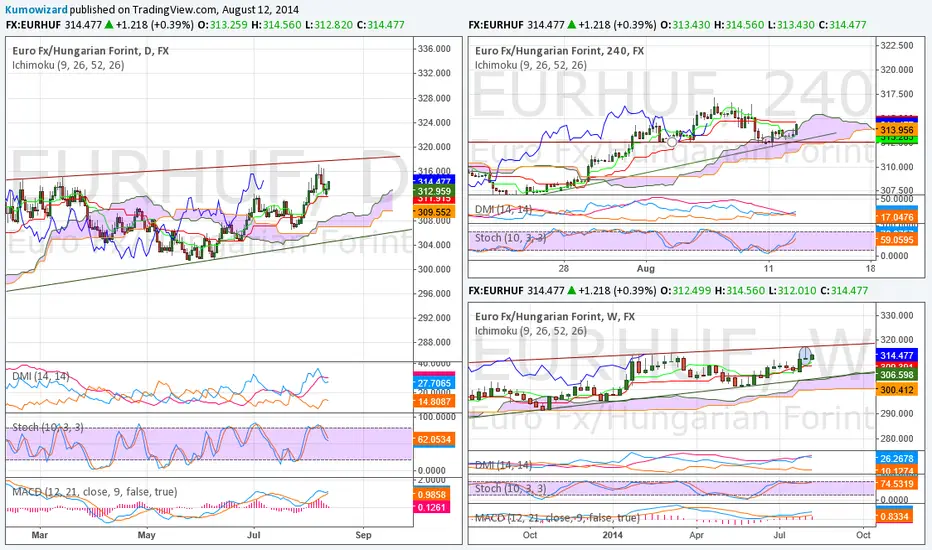
Weekly: We have a long lasting bullish trend, with a kind of long term "wedge" developing same time. Long term Ichimoku setup is still bullish, but last week's candle is remarkable. It was a big hanging man. Any time we have something like this, EURHUF starts a correction within next 1-2 weeks. Slow Stock stuck in overbought level, meanwhile DMI lines started t converge a bit, and DI+ is below ADX now. Weekly trend and Kumo support is ard 305 - 306.
Daily: Ichimoku setup is still bullish. After the 6/Aug pin bar EURHUF pulled back and retested Kijun Sen. During the pullback 316 proved to be a strong resistance. MACD is close to a bearish cross, but no signal yet, and Slow Stoch bearish too, but may turn back on any spike. On daily chart the big question now is if the cross can print any new high, or can make any daily close above 316? If not, it will likely carry out a volatile interim top building, and in this case sell on tops can be a good strategy for an expected correction down to 309,50.
4 Hrs: This lower time frame is mixed now. In fact it shows consolidation. Price trading in/around the Kumo, still below Kijun Sen. Tenkan/Kijun still weak bearish. Chikou Span is below/At Price candles. ADX dropped below 20, so the lower time frame trend is out of steam, DMI is a noise.
Upper resistances: 314,60 (Kijun Sen), 315,40 (future Kumo top), 316,30 (previous Chikou Span peak).
More importantly lower support is: 312,30, which is in line with daily Kijun Sen.
Summary: Long term this pair is still bullish trending, but there are signs it may build some interim top here. The wedge top seen on daily and weekly chart should hold, unless some black swan blows this totally up.
For those looking to short I'd suggest top hunting between 315,50-317,50. The problem with a 4 Hrs counter trend signal in this case is that by then we'll have a firm sell signal (e.g. break below 312,30) the risk reward compared to this products volatility won't be too good. So rather try to monitor Price action ard 315,50-316, which is also appr. 50 % retracement of last week's candle, and try to sell the tops in case. BUild the position in really small clips, and do not allocate too much capital in total. You can never know what happens to global risk appetite, and HUF can become really vulnerable as it has no substantial positive carry any more to protect it in case.
Disclaimer
The information and publications are not meant to be, and do not constitute, financial, investment, trading, or other types of advice or recommendations supplied or endorsed by TradingView. Read more in the Terms of Use.
Disclaimer
The information and publications are not meant to be, and do not constitute, financial, investment, trading, or other types of advice or recommendations supplied or endorsed by TradingView. Read more in the Terms of Use.