1M chart below shows that the price action is contained within the disjoint channel and major support and resistance areas
1W chart below indicates that recently the price was rejected when it tested the resistance at 84.3 and is under consolidation. Any close above the this resistance in 1W timeframe shall be bullish signal.
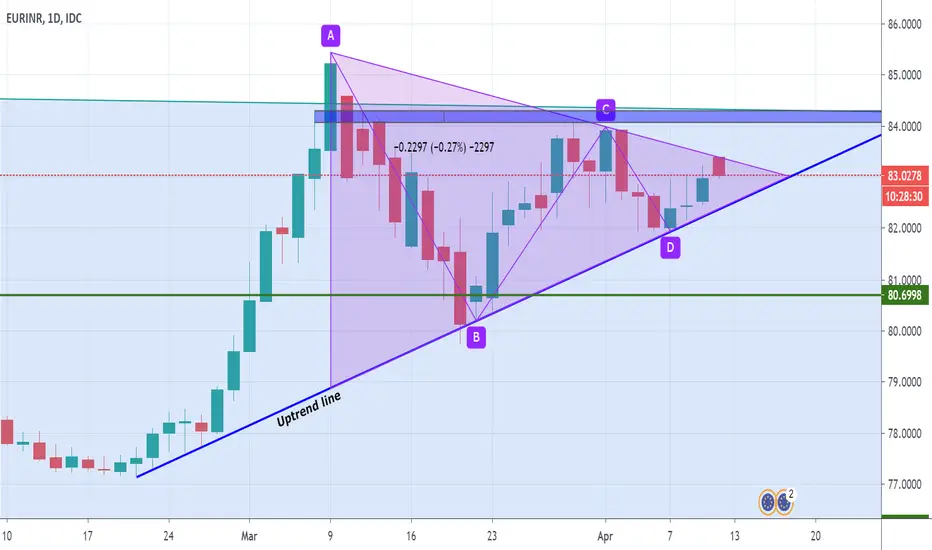
1D chart below implies that the price action is forming a triangle pattern.
Daily close above the triangle pattern shall test 84 to 84.3
Daily close below the triganle pattern shall target 80.7
Comments and debats are welcomed
Note
Price rejected at resistance yesterday. Wait for today's candle to close.
Trade active
Position: Short
Reason: No buy momentum even above the triangle, uptrend line invalidated, and now the momentum is towards selling.
Note
Last update was a premature entry. Not to be considered. Recommended to exitDisclaimer
The information and publications are not meant to be, and do not constitute, financial, investment, trading, or other types of advice or recommendations supplied or endorsed by TradingView. Read more in the Terms of Use.
Disclaimer
The information and publications are not meant to be, and do not constitute, financial, investment, trading, or other types of advice or recommendations supplied or endorsed by TradingView. Read more in the Terms of Use.