1. Overview of the Market Structure
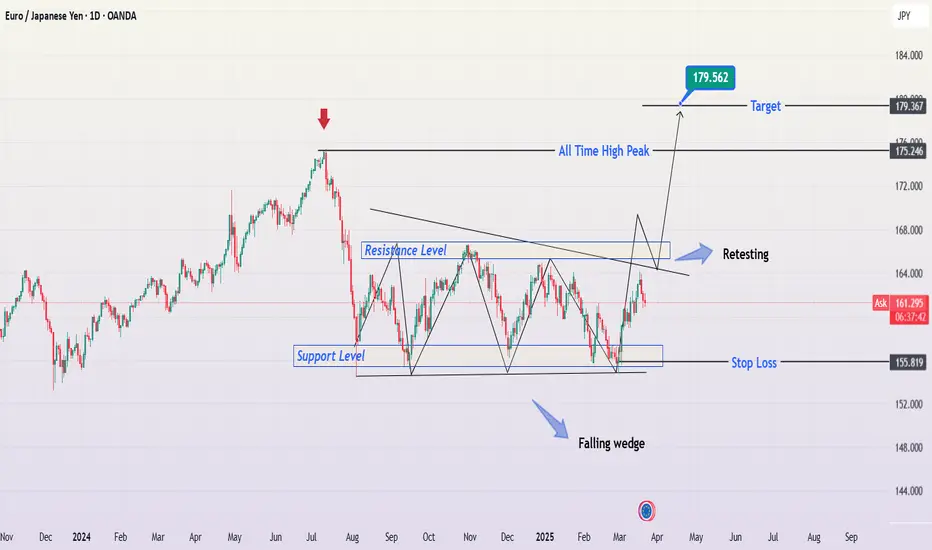
The EUR/JPY daily chart presents a falling wedge pattern, which is a classic bullish reversal setup. This pattern has been forming for several months, indicating that the price has been consolidating within a narrowing range. The falling wedge typically suggests that selling pressure is weakening, and a potential breakout to the upside could follow.
The chart also highlights key support and resistance zones, along with a well-defined trading setup based on technical confluences.
2. Key Technical Levels
Support Level: ~ 155.819 (Marked as Stop Loss)
This level has acted as strong support multiple times.
A break below this level would invalidate the bullish bias.
Resistance Level: ~ 163-164
The price has previously struggled to break above this region.
Currently, it is retesting this level after a breakout attempt.
Target Levels:
175.246 – This aligns with a previous all-time high zone and a strong resistance level.
179.562 – Marked as the ultimate target, indicating a full breakout potential.
3. Falling Wedge Formation & Breakout Analysis
A falling wedge is a bullish pattern that indicates a decrease in selling pressure over time.
The price has tested the lower trendline multiple times, showing strong demand at support.
Recently, the price broke above the upper wedge trendline, suggesting that a breakout is in progress.
However, the breakout needs confirmation in the form of a successful retest at the previous resistance level (~163-164).
4. Retest Confirmation & Trade Setup
Retest Scenario: If the price holds above the previous resistance and confirms it as support, the probability of continuation towards 175-179 increases.
Entry Strategy: A buy entry can be considered after a successful retest with bullish price action confirmation.
Stop-Loss Placement: Below 155.819 (previous strong support).
Risk-Reward Ratio: The target offers a strong risk-reward ratio if the breakout holds.
5. Market Sentiment & Volume Analysis
The previous downward move showed declining bearish momentum, further confirming the validity of the falling wedge.
A volume increase on the breakout would provide additional confirmation.
If the price consolidates near the breakout zone with low volatility, a strong move upward could follow.
Final Conclusion: Bullish Breakout in Progress
The falling wedge breakout suggests that EUR/JPY is poised for further upside.
A successful retest at 163-164 could push the price towards 175.246 and ultimately 179.562.
Risk management is crucial, and a stop-loss below 155.819 is recommended to avoid invalidation of the setup.
This setup presents a high-probability trading opportunity, but confirmation through price action and volume analysis remains key.
Key Trading Plan Summary:
📌 Pattern: Falling Wedge (Bullish)
📌 Breakout Confirmation: Yes, but retesting is ongoing
📌 Entry Point: Above 163-164 after successful retest
📌 Stop Loss: Below 155.819
📌 Target Levels: 175.246, then 179.562
📌 Risk-Reward: Favorable if breakout sustains
Would you like any refinements or a more concise version for your TradingView post? 🚀📈
Related publications
Disclaimer
The information and publications are not meant to be, and do not constitute, financial, investment, trading, or other types of advice or recommendations supplied or endorsed by TradingView. Read more in the Terms of Use.
Related publications
Disclaimer
The information and publications are not meant to be, and do not constitute, financial, investment, trading, or other types of advice or recommendations supplied or endorsed by TradingView. Read more in the Terms of Use.