I’m currently watching EURJPY for a potential upside move based on price action signals.
🔹 Setup Overview
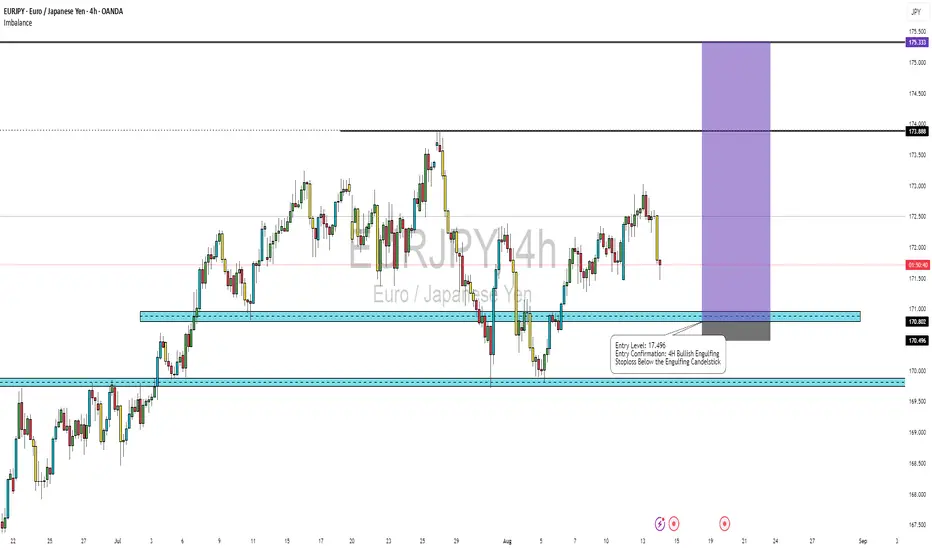
Pair: EURJPY:
Entry Level: 177.496
Entry Confirmation: Bullish Engulfing candle on the 4H timeframe
Stop Loss: Just below the low of the Bullish Engulfing candlestick
📊 Technical Insight
EURJPY has been maintaining a bullish market structure on higher timeframes, with price consistently forming higher highs and higher lows. Recently, price has pulled back to a key support area around 177.496, aligning with a previous structure level and potential demand zone.
I’m waiting for a 4H Bullish Engulfing candle to confirm the buying pressure before entering. This candlestick formation often signals a strong shift in momentum from sellers to buyers, making it a reliable trigger for continuation trades.
🔍 Why This Setup?
Trend Alignment: The daily and weekly charts remain bullish, with strong buying momentum over the past few weeks.
Key Level Reaction: 177.496 coincides with both structural support and a Fibonacci retracement zone, increasing the confluence for a bounce.
Clear Risk Management: Placing the stop loss below the Bullish Engulfing candle low keeps risk defined while giving the trade room to breathe.
🎯 Potential Targets:
TP1: 178.800 (recent swing high)
TP2: 179.900 (psychological resistance)
TP3: 181.200 (extended bullish target)
⚠️ Risk Disclaimer:
This is my personal trading idea based on technical analysis, not financial advice. Always manage risk and follow your own strategy.
🔹 Setup Overview
Pair: EURJPY:
Entry Level: 177.496
Entry Confirmation: Bullish Engulfing candle on the 4H timeframe
Stop Loss: Just below the low of the Bullish Engulfing candlestick
📊 Technical Insight
EURJPY has been maintaining a bullish market structure on higher timeframes, with price consistently forming higher highs and higher lows. Recently, price has pulled back to a key support area around 177.496, aligning with a previous structure level and potential demand zone.
I’m waiting for a 4H Bullish Engulfing candle to confirm the buying pressure before entering. This candlestick formation often signals a strong shift in momentum from sellers to buyers, making it a reliable trigger for continuation trades.
🔍 Why This Setup?
Trend Alignment: The daily and weekly charts remain bullish, with strong buying momentum over the past few weeks.
Key Level Reaction: 177.496 coincides with both structural support and a Fibonacci retracement zone, increasing the confluence for a bounce.
Clear Risk Management: Placing the stop loss below the Bullish Engulfing candle low keeps risk defined while giving the trade room to breathe.
🎯 Potential Targets:
TP1: 178.800 (recent swing high)
TP2: 179.900 (psychological resistance)
TP3: 181.200 (extended bullish target)
⚠️ Risk Disclaimer:
This is my personal trading idea based on technical analysis, not financial advice. Always manage risk and follow your own strategy.
Disclaimer
The information and publications are not meant to be, and do not constitute, financial, investment, trading, or other types of advice or recommendations supplied or endorsed by TradingView. Read more in the Terms of Use.
Disclaimer
The information and publications are not meant to be, and do not constitute, financial, investment, trading, or other types of advice or recommendations supplied or endorsed by TradingView. Read more in the Terms of Use.