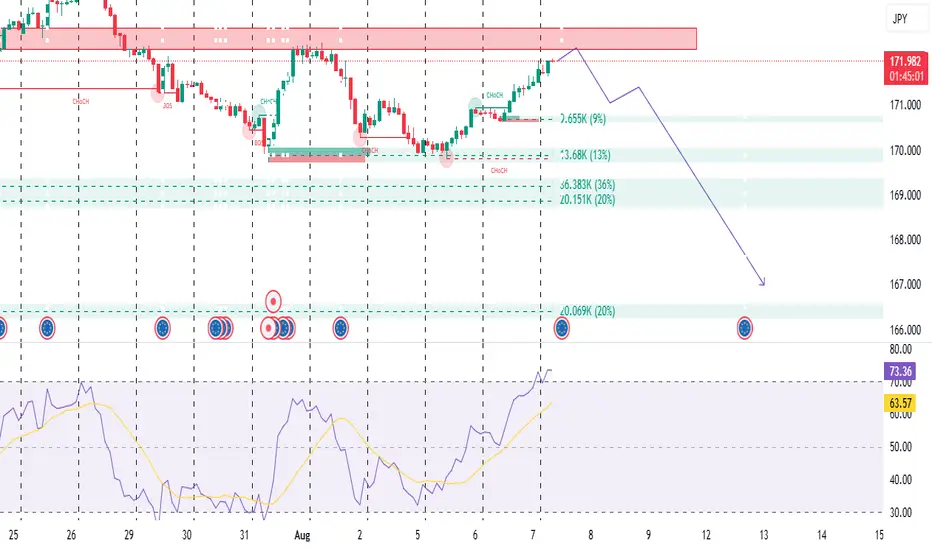
Price has hit a strong supply zone (resistance)
The market has reached a key supply zone, marked by the red shaded area.
This is where sellers previously entered the market aggressively, causing a sharp drop.
Price revisiting this zone suggests a possible rejection or distribution phase by institutional players, RSI is overbought
The Relative Strength Index (RSI) is currently around 73.21, above the 70 threshold → Overbought.
This indicates bullish momentum may be exhausted, and a potential reversal could happen soon.
If price makes a new high but RSI fails to follow → it may lead to a bearish divergence signal.
Trade idea (based on chart):
Sell Entry: 172.00–172.20
Stop Loss: Above 172.40
Take Profit 1: 170.00
TP 2: 168.00
TP 3: 166.99 (final demand zone).
DO YOU AGREE WITH THIS?
Disclaimer
The information and publications are not meant to be, and do not constitute, financial, investment, trading, or other types of advice or recommendations supplied or endorsed by TradingView. Read more in the Terms of Use.
Disclaimer
The information and publications are not meant to be, and do not constitute, financial, investment, trading, or other types of advice or recommendations supplied or endorsed by TradingView. Read more in the Terms of Use.