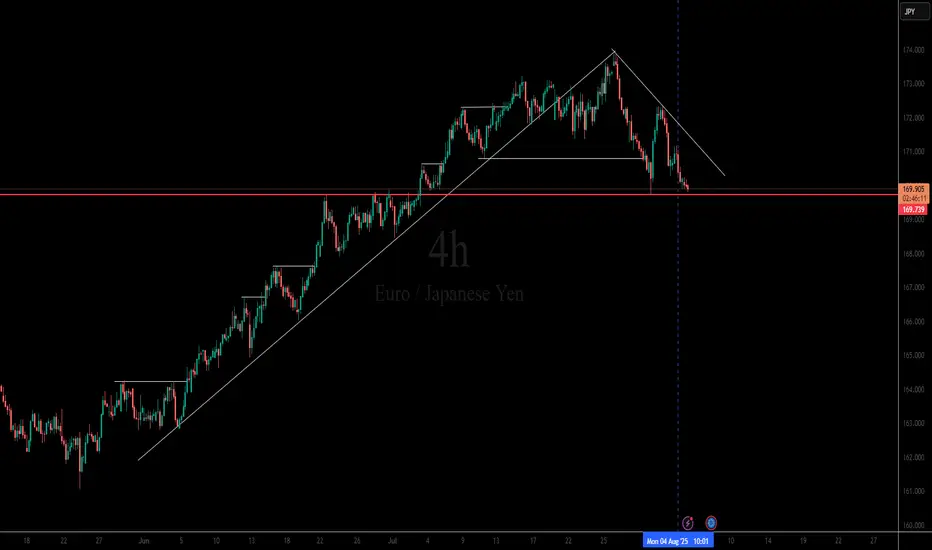
📌 H4 Chart SELL ENTRY LOADING....
Market Structure: Clean uptrend that broke structure to the downside.
Trendline Break: The bullish trendline has been broken and respected as resistance, showing bearish strength.
Support Level: Price is sitting right on a strong horizontal support (~169.74) — tested multiple times in the past.
Bearish Channel Forming: Price is forming lower highs and lower lows, suggesting a bearish trend continuation.
Liquidity Context:
There was likely sell-side liquidity below that horizontal support, which price might aim to sweep.
Buyers defending this area aggressively before; if they fail again, a breakout could accelerate.
FxB
Disclaimer
The information and publications are not meant to be, and do not constitute, financial, investment, trading, or other types of advice or recommendations supplied or endorsed by TradingView. Read more in the Terms of Use.
FxB
Disclaimer
The information and publications are not meant to be, and do not constitute, financial, investment, trading, or other types of advice or recommendations supplied or endorsed by TradingView. Read more in the Terms of Use.