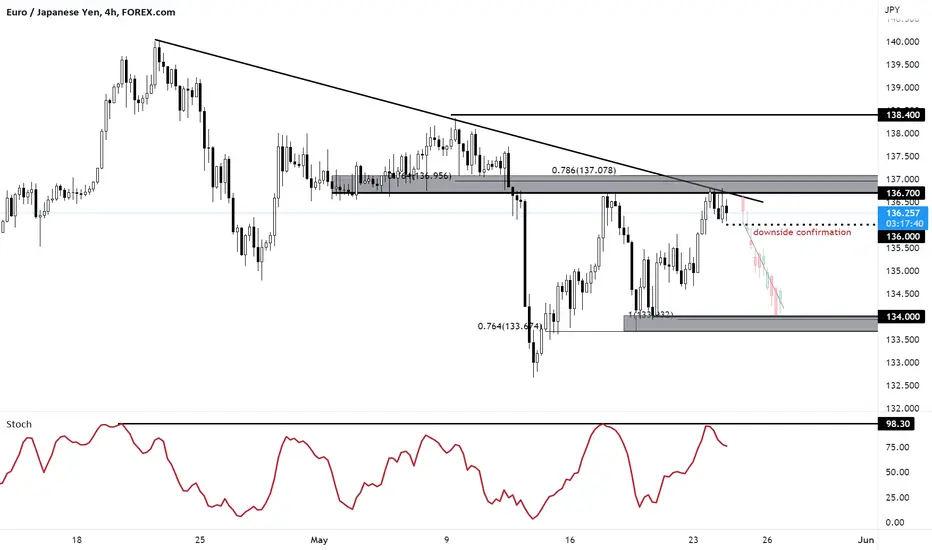
On the monthly time frame, prices are testing a key resistance level at 136.80 where we could see further downside below this level. On the H4 time frame, prices are currently testing a key resistance zone in line with the 76.4% Fibonacci retracement, descending trend line and 78.6% Fibonacci extension. A break below the M15 demand zone at 136.00, would provide the bearish confirmation for a further drop to our support target at 134.00. Stochastic is seeing a bearish divergence and testing resistance at 98.30 as well, supporting the bearish bias.
Disclaimer
The information and publications are not meant to be, and do not constitute, financial, investment, trading, or other types of advice or recommendations supplied or endorsed by TradingView. Read more in the Terms of Use.
Disclaimer
The information and publications are not meant to be, and do not constitute, financial, investment, trading, or other types of advice or recommendations supplied or endorsed by TradingView. Read more in the Terms of Use.