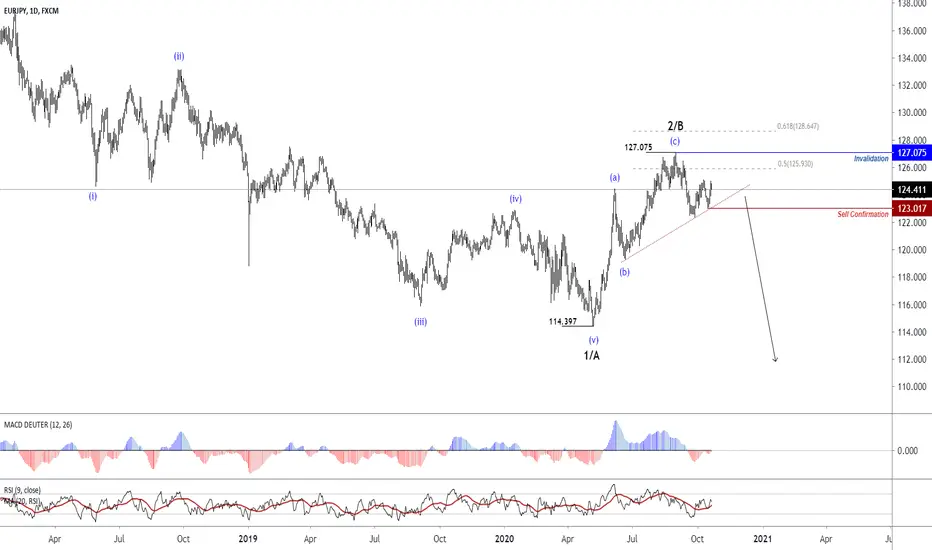
With price ascending to the area of 127.05, three corrective uptrends have been completed and the price is ready to drop further.
The range of 127.07 is a very important area:
In weekly time frame, this range hits the bearish trendline, which is located in the 50% Fibonacci range, which increases the advent of a downtrend.
To confirm the downtrend, the price requires to cross the range of 123.01, when this happens, the downtrend line will break out (the red dotted line). However, if the price can be closed above the range of 127.07, this analysis will be nulled.
Disclaimer
The information and publications are not meant to be, and do not constitute, financial, investment, trading, or other types of advice or recommendations supplied or endorsed by TradingView. Read more in the Terms of Use.
Disclaimer
The information and publications are not meant to be, and do not constitute, financial, investment, trading, or other types of advice or recommendations supplied or endorsed by TradingView. Read more in the Terms of Use.