(EUR/JPY 1H Chart):
1. Previous Uptrend (Left Side):
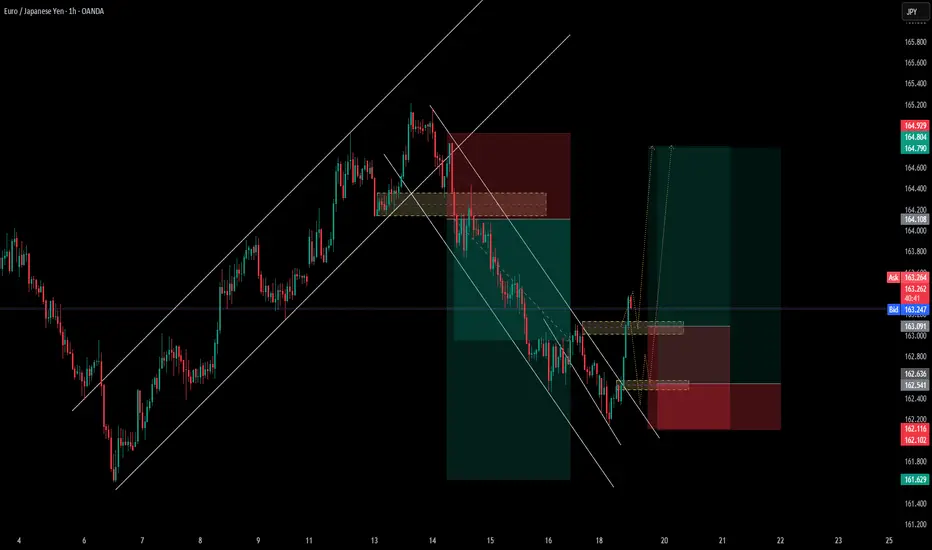
The price was previously moving within a well-defined ascending channel (marked by white parallel lines).
Eventually, the price broke below the ascending channel, signaling a potential trend reversal.
2. Downtrend Phase (Middle Section):
After breaking out of the bullish channel, the price entered a descending channel.
A short position was executed here, with a visible stop-loss (red zone) and take-profit (green zone).
This short trade was successful — the price reached the take-profit level.
📌 Current Market Setup (Right Side):
3. Breakout from the Downward Channel:
The price has broken out of the descending channel to the upside.
This breakout may indicate the start of a new bullish wave.
4. Anticipated Pullback:
A pullback is expected toward a nearby demand zone (highlighted with a yellow rectangle).
After the pullback, a continuation to the upside is projected — reflected by a long position with a large risk-to-reward ratio (roughly 1:3 or higher).
📈 Pattern and Scenario:
A trend reversal pattern is forming following the breakout from the descending structure.
The projected structure follows the pattern: Impulse – Pullback – Impulse.
This is a classic bullish continuation setup.
🧠 Conclusion:
Pattern: Reversal and bullish continuation.
Bias: Bullish, especially after confirmation of the demand zone.
Strategy: Wait for a retest of the demand zone for a safer long entry. An aggressive entry could be made on breakout confirmation.
1. Previous Uptrend (Left Side):
The price was previously moving within a well-defined ascending channel (marked by white parallel lines).
Eventually, the price broke below the ascending channel, signaling a potential trend reversal.
2. Downtrend Phase (Middle Section):
After breaking out of the bullish channel, the price entered a descending channel.
A short position was executed here, with a visible stop-loss (red zone) and take-profit (green zone).
This short trade was successful — the price reached the take-profit level.
📌 Current Market Setup (Right Side):
3. Breakout from the Downward Channel:
The price has broken out of the descending channel to the upside.
This breakout may indicate the start of a new bullish wave.
4. Anticipated Pullback:
A pullback is expected toward a nearby demand zone (highlighted with a yellow rectangle).
After the pullback, a continuation to the upside is projected — reflected by a long position with a large risk-to-reward ratio (roughly 1:3 or higher).
📈 Pattern and Scenario:
A trend reversal pattern is forming following the breakout from the descending structure.
The projected structure follows the pattern: Impulse – Pullback – Impulse.
This is a classic bullish continuation setup.
🧠 Conclusion:
Pattern: Reversal and bullish continuation.
Bias: Bullish, especially after confirmation of the demand zone.
Strategy: Wait for a retest of the demand zone for a safer long entry. An aggressive entry could be made on breakout confirmation.
Disclaimer
The information and publications are not meant to be, and do not constitute, financial, investment, trading, or other types of advice or recommendations supplied or endorsed by TradingView. Read more in the Terms of Use.
Disclaimer
The information and publications are not meant to be, and do not constitute, financial, investment, trading, or other types of advice or recommendations supplied or endorsed by TradingView. Read more in the Terms of Use.